Information Processing | Term 1 Chapter 6 | 5th Maths - Bar graph | 5th Maths : Term 1 Unit 6 : Information Processing
Chapter: 5th Maths : Term 1 Unit 6 : Information Processing
Bar graph
GRAPHICAL REPRESENTATION OF DATA
Bar graph
A
Bar graph is a chart that uses bars to show comparisons between categories of
data. The bars can either be horizontal or vertical.
Example 1
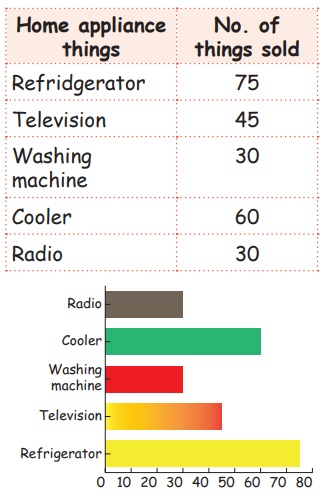
The number of things sold in a month of
January in a particular shop is shown below. Draw a bargraph.
Activity 1
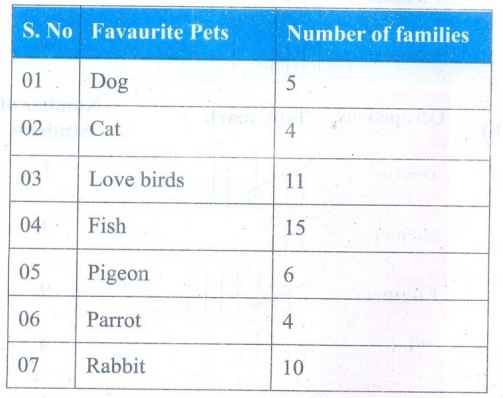
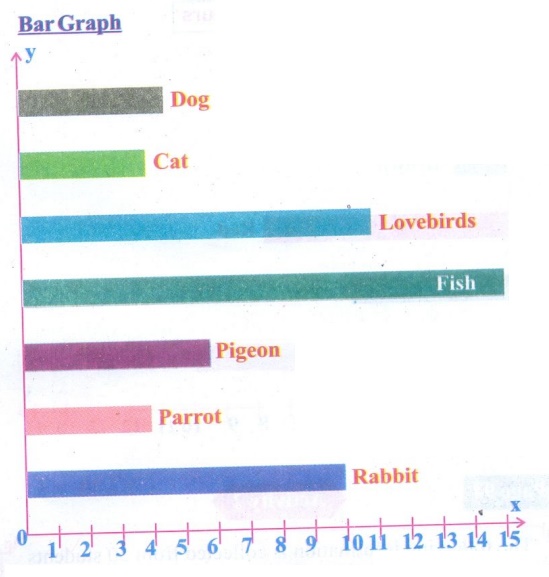
1. Take a survey among your friends and family on their
favourite pets. Use the information to draw a bargraph.
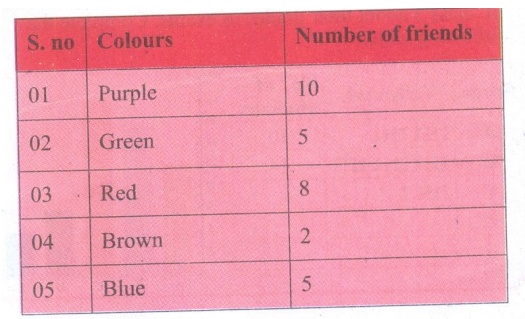
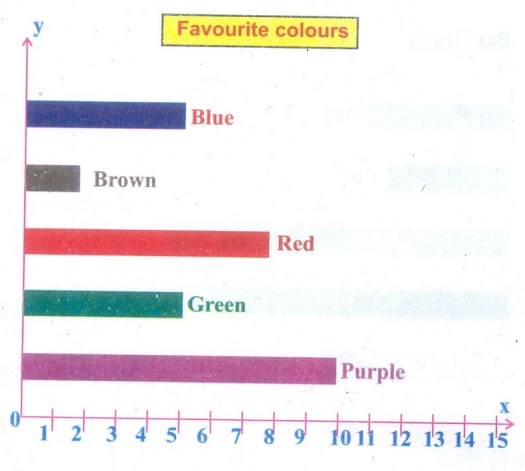
2. Take a survey among your school friends or their favorite
colour. (key: Purple, Green, Red, Brown, Blue) Draw a bargraph to represent your
data.
Activity 2
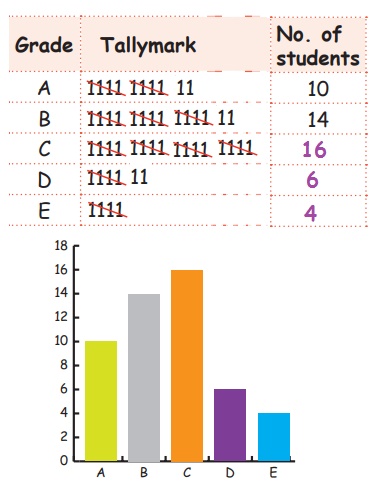
The following information
is collected from 50 students of class 5 about their grades in exams. Complete
the following table.
Example 2
In Trichy, a GHSS has five different
clubs. The data shows the number
of students in each club. Use the information to draw a bargraph and answer the
questions.

1)
Which club has the fewest students? How many?
Answer: Arts
club 28
2)
How many students are there in art and debate clubs?
Answer:
28+80=108
3)
Find how many students are there in the sports club more than the drama club?
Answer:
20
4)
How many students are there in all clubs together?
Answer: 478
Activity 3
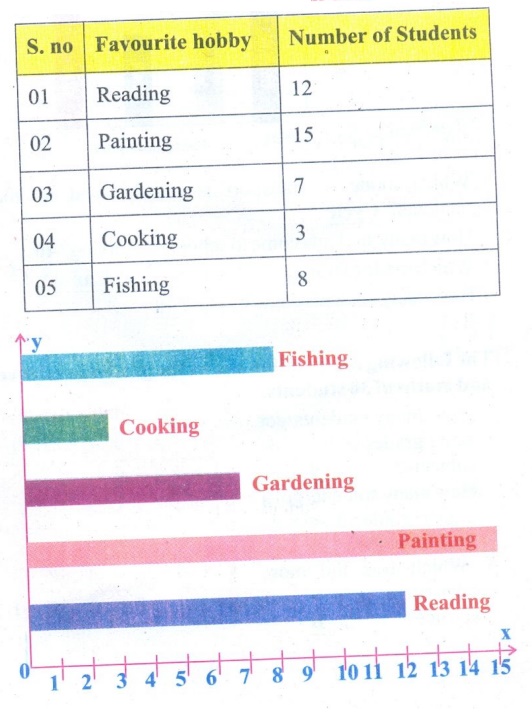
Take a survey among your classmates on their favourite hobby.
[Clue: Reading, Painting, Gardening, Cooking, Fishing] Draw bargraph to
represent your data.
Related Topics