Information Processing | Term 1 Chapter 6 | 5th Maths - Graphical Representation of Data | 5th Maths : Term 1 Unit 6 : Information Processing
Chapter: 5th Maths : Term 1 Unit 6 : Information Processing
Graphical Representation of Data
GRAPHICAL REPRESENTATION OF DATA
Graphical Representation of Data
Any collection of information in the
form of numerical figures giving the required information is called Data.
In olden days, primitive man used to count and
verify his livestock using stones.This
is the first data gathering method. Nowadays we use many methods to collect
information the most efficient method is to keep a "tally stick".
Example 1
An information was collected about the
number of vehicles which crossed a school on a particular time.
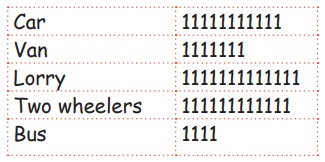
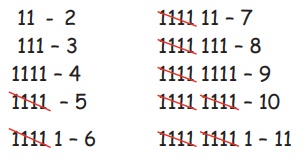
‘1’ is called a ‘tally mark’. It is
difficult to count if there are more number of tally marks. Therefore to make
it easier to count, we change it as follows.
Note: We can use tallymark to record data with large numbers.
Solution
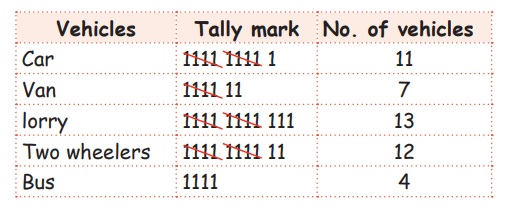
Answer
the following questions:
1. Which vehicle crossed the school
maximum in numbers?
Answer: lorry
2. Find the total number of vehicles
which crossed on a particular time?
Answer: 47
Example 2
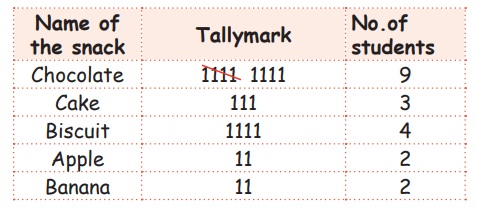
Information was collected by Balu from
20 students of class five regarding their favourite snacks. Tabulate the given
information.
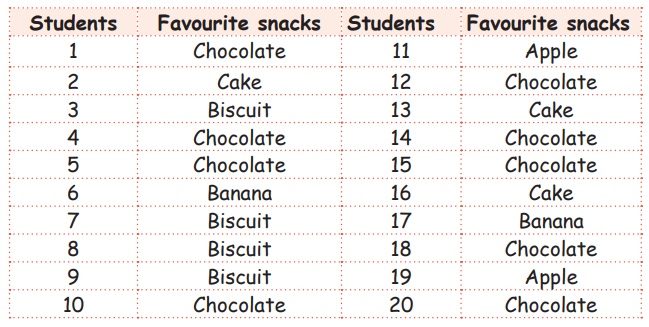
Tabulate the above information by
using Tallymark. Here, all the students have chosen any one of the snacks we
can tabulate it as follows.
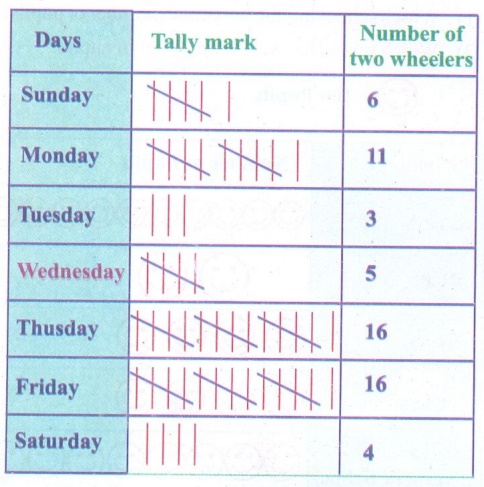
Activity 1
The number of two-wheelers sold during a week in a show room is
given below. Represent the data using tally marks.
Sunday – 6
Monday −11
Tuesday −3
Wednesday −5
Thusday −16
Friday −16
Saturday −4
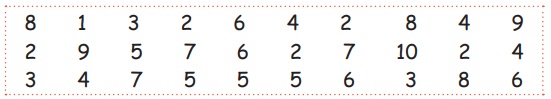
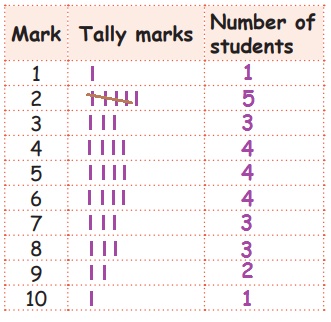
Activity 2
In a mathematics test, the
following marks were obtained by 30 students. Arrange these marks in a table
using tally marks.
(a) Find how many students
obtained marks equal to or more than 8? 6
(b) How many students
obtained marks below 4? 9
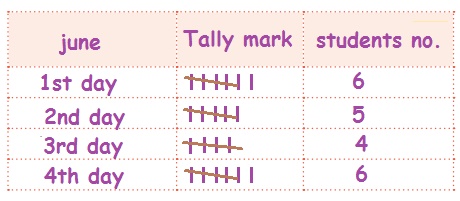
Try this
Ask the students to collect the information about the number of students present in a particular day of the school. Tabulate the above information using tally marks.
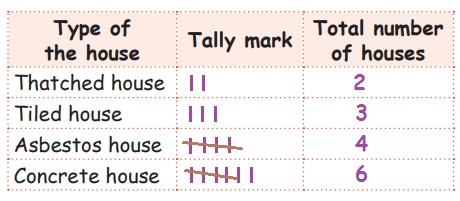
Do it yourself
Ask
the students to collect information about the different types of houses in their
villages and complete the following table.
Try
yourself
Choose
any five cities and record their temperature from the
TV (or) Newspaper.
Chennai
35. 6 0C
Tenkasi
300 C
Kodaikanal
220 C
Madurai
41.40 C
Coimbatore
38.20
Kanyakumari
32.800 C
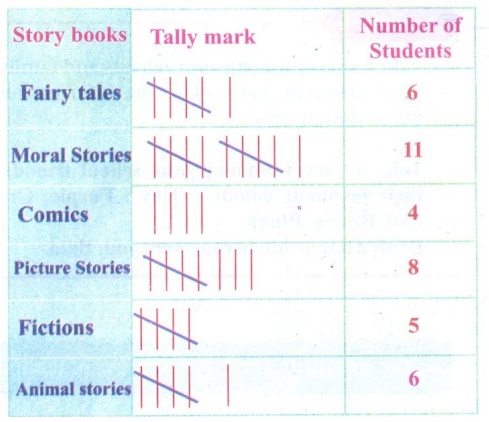
Try this
Collect information based
on the points given below and prepare a table using tally marks
(a) Which story book do your classmates like?
Clue [Fairy tales, Moral stories, Comics, picture stories,
fictions and animal stories]
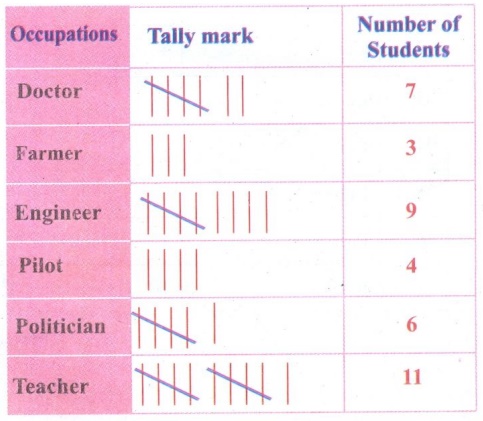
(b) What do your
classmates want to become when they grow up?
Clue [Doctor, Farmer, Engineer, Pilot, Politician, Teacher]
Related Topics