Chapter: Pharmaceutical Drug Analysis: Nuclear Magnetic Resonance Spectroscopy
Nuclear Magnetic Resonance Spectroscopy: Theory
THEORY
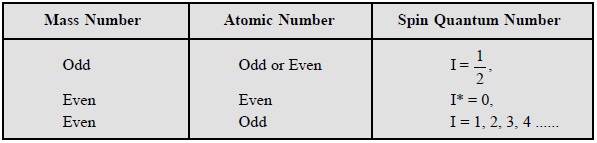
Almost fifty per cent of the nuclei known so far behave
as if they were spinning as a whole about an axis just like a minute bar
magnet, the axis of which happens to be coincident with the axis of spin. The
angular momentum of the charge created by the spinning electrons may be
expressed in terms of spin quan-tum number designated as ‘I’ (in units of h/2π
were h is Planck’s constant). Therefore, for a nuclei to exhibit NMR
phenomenon the spin quantum number I is always greater than 0. The spin quantum
number I is directly associated with the mass number and the atomic number of
the nuclei. Pope et al. (1959) has
put forward a detailed list of spin quantum values vis-a-vis mass number and atomic number so as to facilitate in
establishing the value of I empirically as shown below :
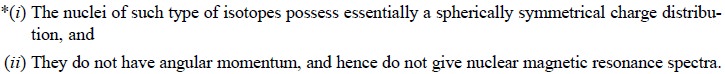
From the above useful data provided one may draw an inference
that spin numbers have either ‘inte gral’ or ‘half-integral’ values ranging
from 1/2 to at least 9/2 for different nuclei. The spin number is obtained by
the addition of individual protons and neutron spin numbers of ½ each, with the
restriction that neutrons can cancel only neutrons and protons can cancel only
protons.
Precisely three
classes of nuclei may be neatly distinguished, namely :
(a) Zero-spin (I = O) : Those where both the number
of protons and neutrons are even, for instance : 12C, 16O,
and 32S. Nuclei in this category do not interfere with a NMR-signal
from other nuclei. In case, 12C and 16O has also been
magnetic per chance, the NMR spectra of organic molecules cer-tainly would have
been much more difficult and complex.
(b) Half-Integral Spin: Those where either the number
of protons or the number of neu trons is odd. This constitutes the most
important group of nuclei for their immense applications and utility to a
medicinal chemist and an organic chemist.
Examples* :
They are 1H ; 3H ;13C ;
19F ; 31P ; 15N ; 29S
;
(c) Integral Spin (I = 1/2) : Those where
both the number of protons and the number of neutrons is odd.
Examples : Where 1 = 1, are : 2H
(Deuterium) and 14N ; and where I > 1 are : 10B ; 11B
; 35Cl
; 17O
; 27Al
;
In other words, isotopes having a spin value equal to, or
greater than one exhibit an ellipsoidal charge distribution and have spin. They
invariably possess a nuclear electric quadrupole moment, desig-nated as ‘Q’.
1. ORIENTATIONS OF MAGNETIC NUCLEUS UNDER Bo
Under the influence of external magnetic field, Bo, a
magnetic nucleus may take up different orientations with regard to that field,
for instance :
(i) Two orientations : The number of
possible orientation is given by (2I + 1), so that for nuclei with spin 1 e.g., 1H, 13C, 19F only two orientations are allowed, and 2
![]()
(i)
Three orientations : Both 2H
(Deuterium) and 14N have I = 1 and, therefore, can take up three
orientations. These nuclei essentially possess both electric quadrupoles and
magnetic dipoles.
2. PRECESSIONAL FREQUENCY (ν)
In any magnetic field, magnetic nuclei like the proton
precess at a frequency ν, which is proportional to the
strength of the applied field. The exact frequency is expressed by :

where, Bo = Strength of the external field experienced by the proton,
I = Spin quantum number,
h = Planck’s constant (6.626 ×
10 –34 Js),
μ= Magnetic moment of the particular nucleus, and
βN =
Nuclear magnet on constant.
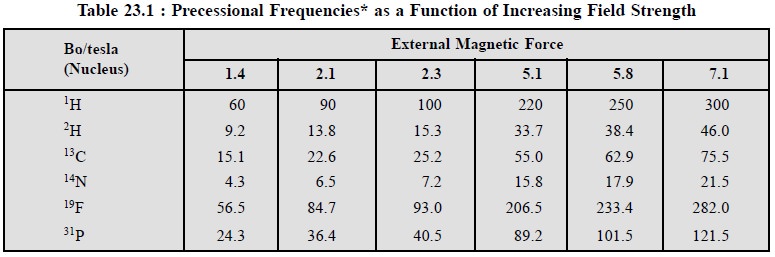
Table 23.1 records some typical approximate values of ‘ν’ for (a) selected values of field strength Bo, and (b) common magnetic nuclei.
(Free Electron) 3.9 × 10 4
The data from Table 23.1, reveals that :
(a) magnetic
moments of 1H and 19F are relatively large and,
therefore, detection NMR-signals with these nuclei are fairly sensitive,
(b) Magnetic
moment of 13C is almost 1/4 that of 1H i.e., the former is less sensitively
detected in NMR as compared to the latter,
(c) Similarly,
magnetic moment of 2H (Deuterium) is approximately 1/6th that of 1H
(less sensitively detected in NMR), and
(d) Even with
very large magnetic fields, upto 7.1 T, the energy difference (∆ = hν)
is very small, upto 300 MHz ; because the difference is so small ( −~
10–4 kJ mol–1) the number of protons in the two energy
states are almost equal.
3. SATURATION OF THE SIGNAL
It has been observed that nuclei in the lower energy
state undergo transitions to the higher energy state. The populations of the
two states may approach equality, and if this situation arises no further net
absorption of energy take place, and the observed NMR resonance signal will
fade out. This particular situation is termed as saturation of the signal.
It is pertinent to mention here that in a small NMR
spectrum the populations in the two spin states never become equal, by virtue
of the fact that higher energy nuclei are constantly returning to the lower
energy spin state.
4. ABSORPTION POSITIONS IN NMR-SPECTRUM
For different types of organic compounds and
pharmaceutical substances the resonance positions for protons lie usually
within a narrow range (~ 600 Hz). As the differences in the signal’s positions
are small in comparison to the applied frequency (60 × 10 6 Hz or 60
MHz), therefore, the absolute measurements of absorption positions cannot be
made with the required degree of accuracy (0.1 Hz 60 × 10 6 Hz, i.e., 1 part in 108).
However, it is quite possible to measure the differences in frequency relative
to a standard substance with the required degree of accuracy and precision.
5. CHEMICAL SHIFT
The chemical shift (δ)
is defined as the difference between the resonance position of a nucleus and
that of a standard reference compound. It is normally expressed in terms
independent of Ho (or the related applied resonance frequency ν) :

where, ∆ν = Difference in frequency (Hz) between the observed
signal and that of the standard (reference compound).
Reference Compound : For 1H NMR i.e., Proton-NMR, tetramethyl silane
(TMS), (CH3)4Si, is
employed mostly as the reference compound, because of the fact that its
protons resonate at higher field strength than most other protons.
Convention for δ : TMS assigned (δ = 0), values for other protons
are measured positively downfield.
In other words, increasing δ
corresponds to increasing de-shielding of the nucleus.
6. SPIN-SPIN INTERACTIONS
High resolution NMR spectra very often exhibit signals as
multiplets, invariably showing a more or less symmetrical appearance.
Multiplicity is brought about due to the splitting of the
signal of one set of equivalent nuclei by the magnetic fields of adjacent sets
of nuclei i.e., spin-spin interactions. The distance between the peaks of a regular
multiplet is termed as the coupling constant, designated as J, and measured in
Hz.
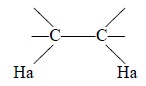
The protons Ha and Hb are totally in different chemical
environments. There is a significant differ-ence in their chemical shifts
because of the variance in the resonance positions of their nuclei. Thus, Ha
experiences a total magnetic field comprising of : external field (Ho) and
local field due to Hb as shown in Figure 23.3.
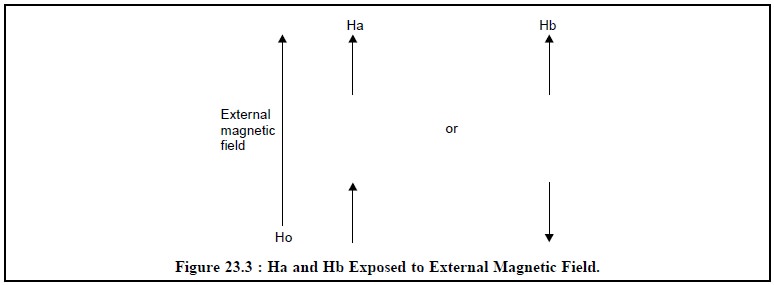
From Figure 23.3, it is evident that Ha, at a given
constant, experiences the local field of Hb that may be either aligned with or
against that of Ha.
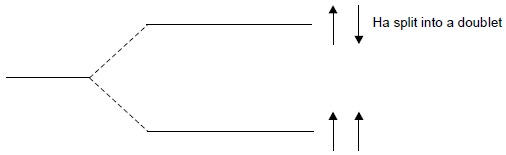
The Ha signal is split into a doublet and the peaks of
this doublet will be equal in height, because each alignment of spins has equal
probability.
Based on the same reasonings, the signal emerged from Hb is split into a doublet as shown below : The spin-alignments of Hb1 and Hb2 may be designated as :
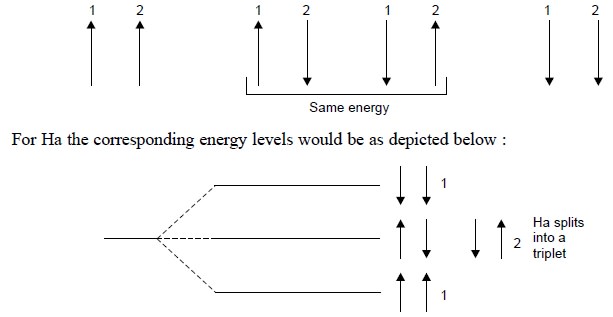
The probability of each of the above cited four spin
arrangements is equal, two having the same energy ; thereby giving rise to a
triplet for the signal of Ha, having peak heights in the ratio 1 : 2 : 1.
Therefore, generalizing the spin-spin interactions cause
a signal to be split into (n + 1)
peaks, where ‘n’ is the number of
interacting nuclei on the adjacent carbon atom.
Hence, two
important observations are usually made, namely :
(a) Coupling
constant, J, is independent of Ho (contrast with δ),
and
(b) Regular
multiplets are produced when the difference in chemical shifts (in Hz) between
nuclei A and X (i.e., ∆νAX) is large relative to the
coupling constant JAX, i.e.,
when ∆νAX/JAX ≥ ∼ 10.
The spectra obtained in this manner designated as First
Order, and these may be analysed with the help of the following FOUR general
RULES, namely :
RULE : 1 : Multiplets caused by mutual
interaction of nuclei A and nuclei X have identical J values,
RULE : 2 : Interaction of nucleus A with
a group of n magnetically
equivalent nuclei X (of spin IX), produces
a multiplet of (2nx, Ix + 1) peaks,
RULE : 3 : Intensities of the multiplet
are asymmetrical about the mid-point of the signal, that corre-sponds to the
origin of the multiplet and is equal to the chemical shift.
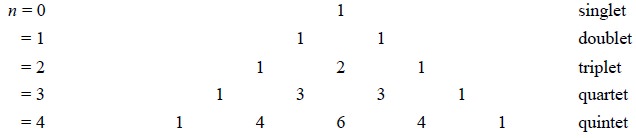
Pascal’s Triangle : The nuclei having spin quantum
number I = 1/2, relative intensities of the multiplet’s peak are given by the coefficients of the binomial expansion, (1 +
x)n,
where n = number of nuclei
interacting with the specific nucleus emitting the signal ; or by Pascal’s Triangle as given below :
RULE : 4 : Interaction is normally
observable between close groups of magnetically non-equivalent nuclei.
This exclusively deals with nuclei of spin 1/2 and,
therefore, the examples and applications shall be given from 1H i.e., proton magnetic resonance (PMR) spectroscopy.
However, a brief description of the following three types of NMR-spectroscopy will be
made here so as to apprise the readers about their principles and main usages
only, such as :
(i) 3H-NMR
(Tritium NMR Spectrocopy),
(ii) 13C-NMR
Spectroscopy, and
(iii) 2D-NMR
(Two Dimensional Correlation Spectrocopy ; or Two Dimensional COSY Spectrum).
7. 3H-NMR (TRITIUM NMR-SPECTROSCOPY)
The ease with which ‘tritium’
could be employed for labelling organic compounds, having fairly high molar
specific activity, has turned it into a very useful and versatile β-emitting
radionuclide for chemi-cal and life sciences research. The unique novel
characteristic feature of tritium tracers being that it may be used as a tracer
for carbon as well as hydrogen structures. A non-destructive method of analysis
was initiated in Great Britain* employed elaborated sophistically designed
instrumentations** armed with ‘supercon’
magnets and latest computer technology.
The comprehensive dedicated research ultimately made it
possible to decode the patterns of labelling in almost any type of tritium
labelled compound at low isotopic abundance (e.g., 3 × 10 –4 to 3 × 10 –2 per cent. 3H
per site) with the aid of 3H-NMR directly, rapidly, reliably and
non-destructive analytical means. Since, 1971, the 3H-NMR
spectroscopy, utilizing only millicurie (mCi) quantities of radioactivity,
emerged as a most useful analytical tool for the study of tritium labelled
compounds.
The two major
advantages of 3H-NMR spectroscopy based on the characteristic
magnetic features of the tritium nucleus are, namely :
(a) High
receptivity of the tritium nucleus, i.e.,
only small amounts of radioactivity (0.1 to 10 mCi per site, 3.7 to 370 MBq) are
needed to bring about a well-defined spectrum, and
(b) Similarity
of the chemical shifts of 3H nuclei and those of 1H
nuclei (protons) i.e., the copious
volume of available data on ‘proton-chemical shifts’ may be applied directly
for the interpretation of 3H-NMR spectra. In other words no new
correlations need to be determined, as in the case for 13C-NMR-sepctroscopy.
The various advantages of 3H-NMR spectroscopy
are, namely :
·
a rapid direct and non-destructive method,
·
provides direct information on regiospecificity,
·
gives quantitative distribution of the label,
·
caters for accurate and precise information on the
stereochemistry of the label, and
·
requires only millicuries (mCi) rather than microcuries
or lesser amounts of radioactivity.
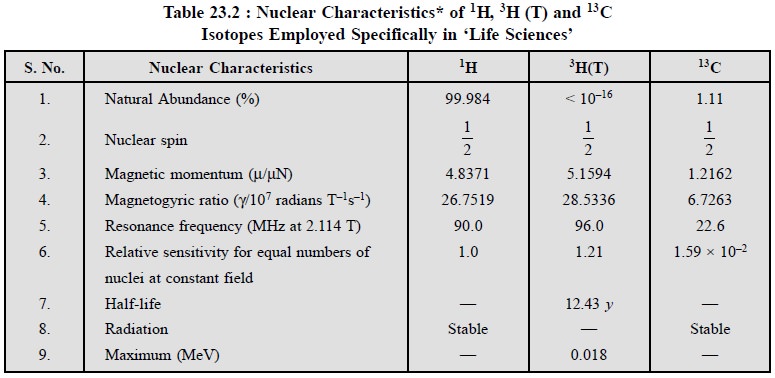
Table 23.2, records the nuclear properties of 1H,
3H (T) and 13C isotopes being employed particularly in
various arms of ‘Life Sciences’ :
8. 13C-NMR-SPECTROSCOPY
The ‘carbon-skeleton’ has been viewed directly with the
help of Carbon-13 NMR spectroscopy on a particle basis since early 1970’s ;
whereas 1H-NMR spectrometry started in late 1950’s. The valuable
contri-bution made by various researchers**, between 1976 and 1980, has
virtually placed 13C-NMR to a strategi-cally much advanced stage
where it gives a clear edge over 1H-NMR in terms of not only its
versatility but also its wide application in analysis.
13C-NMR refers to recording
another NMR-spectrum but of the C-13 atoms rather than the hydrogen atoms. In
actual practice, however, -‘these spectra are recorded in such a manner that
each chemically dis-tinct carbon gives rise to single peak, without any
coupling or fine structure’.
Hence, simply a count of the peaks can be used to see how
many carbons are actually present in the molecule. But this particular
technique is not reliable for a molecule that exhibits symmetry, because this
would ultimately reduce the number of peaks.
It is interesting to note that 12C nucleus is
not magnetically ‘active’ (spin
quantum number I = 0), whereas the 13C nucleus, like the 1H
nucleus, has a spin number I =1/2 .
Keeping in view the nuclear charac-teristic features one may observe that the
natural abundance of 13C is equal to 1.1% that of 12C and
also the sensitivity of 13C is equal to 1.6% that of 1H.
Therefore, the overall sensitivity of 13C compound with 1H
stands at 1/5700.
![]()
There are three
short-comings of 13C-NMR spectra, namely :
1.
Only 1% of the carbon in the molecule is carbon-13,
2.
Sensitivity is consequently low, and
3.
Recording the NMR-spectra is a tedious and time consuming
process. However, with the advent of recent developments in NMR-spectroscopy it
is quite possible to eliminate some of these short comings adequately. They are
:
(a) Development
of powerful magnets (‘supercon’ magnets)
has ultimately resulted in relatively stronger NMR-signals from the same number
of atoms,
(b) Improved
hardware in NMR-spectroscopy has gainfully accomplished higher sensitivity, and
(c) Development
of more sensitive strategies has made it possible to record these C—H
correla-tion spectra in a much easier manner.
Therefore, it is now possible either to record the 13C-NMR
signal and place the hydrogens in the undetected ‘second dimension’ or to record the signal from the hydrogens and
place the 13C resonances in the ‘indirect
dimension’.
In actual practice, the latter mode is technically more
demanding and affords results that are much higher in sensitivity. Recent
developments in NMR-spectrometer hardware and technique have made this
more-sensitive-mode of operation, termed as ‘inverse-detection’, rather readily applicable to modern analy-sis.
9. 2D-NMR (TWO DIMENSIONAL CORRELATION SPECTROSCOPY OR TWO DIMEN-SIONAL COSY SPECTRUM)
The interaction between different hydrogens in a
molecule, known as ‘scaler’ or ‘spin-spin cou-pling’, transmitted
invariably through chemical bonds, usually cover 2 or 3 at the most. Therefore,
when a hydrogen with a chemical
shift ‘A’ is coupled to a hydrogen with chemical shift ‘B’, one would
immediately make out that the hydrogens must be only 2 or 3 bonds away from one
another. To know exactly with particular hydrogens are coupled to one another
it is necessary to record a two-dimensional ‘Correlation Spectroscopy’ (COSY)
spectrum.
Generally, a normal NMR-spectrum has amplitude plotted Vs just one frequency-dimension (the ppm
scale). In 2D-NMR, the amplitude is plotted Vs two frequency-dimensions (two ppm scales), normally in the form
of a counter plot, just like a topographic map.
The most important aspect about these 2D-NMR spectra is
that they show the relation between the peaks in an NMR-spectrum.
Example : A peak at ordinate A ppm in
one dimension and B ppm in the other simply indicates that a hydrogen
with shift A is duly coupled to a hydrogen with shift B. In short, this is all
the information which one needs to interpret in a COSY-spectrum. Thus, the
resulting chemical shifts of coupled protons may be simply read off the
spectrum.
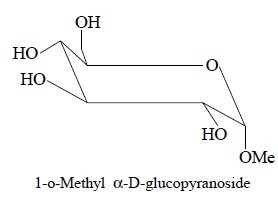
Figure 23.4, illustrates the two dimensional COSY
spectrum of a sugar : 1-0-methyl α-D-glucopyranoside (1) that
has been recorded on a 400 MHz NMR-spectrometer ; the sample was dissolved in D2O
so that the OH protons get duly exchanged with Deuterium and are, therefore,
not seen at all. Besides, the 1H-NMR-spectrum has also been shown alongside
both axis of the two dimensional spectrum in Figure 23.4.
Salient features of 1H-NMR and 2D-NMR spectra
are, namely :
1.
At 3.25 ppm a sharp intense peak, labelled B, is
characteristic of an —OMe moiety
2.
At 4.6 ppm there appears another strong peak which is due
to the presence of some residual HDO in the D2O that was initially
employed to dissolve the sample,
3.
At 4.65 ppm, the two peaks or multiplets are due to H
which are distinctly separated from the rest of the spectrum. These are known
to belong to the aromatic proton H1 which is present adjacent to two
oxygen atoms, and
The COSY-spectrum (Figure 23.4) depicts a so called
cross-peak CH at F1 = 4.65 ppm ; F2 = 3.4 ppm which means
that the proton is coupled to another proton whose shift is 3.4 ppm.
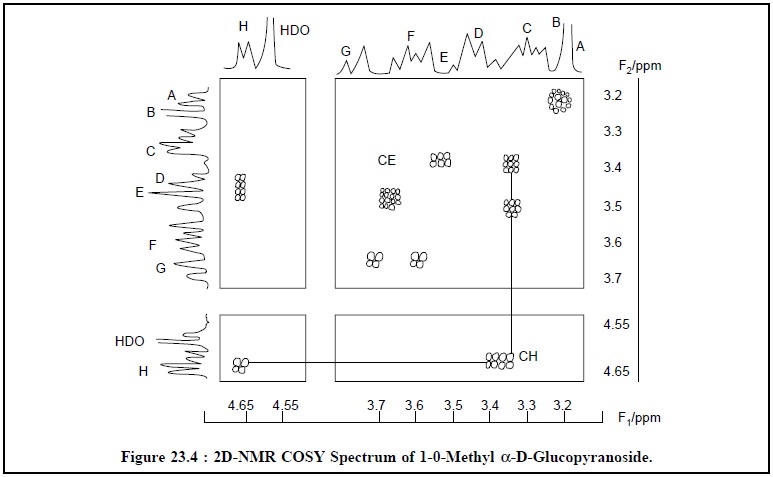
Thus, looking at the structure of compound (1), the
resonance C at 3.4 ppm may be due to H2 by connecting it to H1.
Following along it may be observed that from multiplet C
there exists another cross-peak, CE at F1 = 3.5 ppm, F2 =
3.4 ppm, suggesting thereby that the proton resonating at 3.4 ppm is duly
coupled to one resonating at 3.5 ppm ; this identifies multiplet E as H3.
In fact, from this single COSY-spectrum (Figure 23.4) one may identify the
complete chain of coupled protons as it goes round the pyranose ring.
However, in actual practice with a little skill and
expertise one may :
(i) Read off
the bonding network from the spectrum,
(ii) Interpret
a COSY spectra easily, because without it finding the coupled pairs of
hydrogens is mostly not only ambiguous but also time-consuming, and
(iii) Reveal a few chains of coupled resonances.
Related Topics