Definition, Formula, Properties, Solved Example Problems - Normal Distribution | 11th Statistics : Chapter 10 : Probability Distributions
Chapter: 11th Statistics : Chapter 10 : Probability Distributions
Normal Distribution
Continuous distributions:
NORMAL DISTRIBUTION
Introduction
The Normal distribution was first discovered by the English
Mathematician De-Moivre in 1733, and he obtained this distribution as a
limiting case of Binomial distribution and applied it to problems arising in
the game of chance. In 1774 Laplace used it to estimate historical errors and
in 1809 it was used by Gauss as the distribution of errors in Astronomy. Thus
throughout the 18th and 19th centuries efforts were made
for a common law for all continuous distributions which was then known as the
Normal distribution.
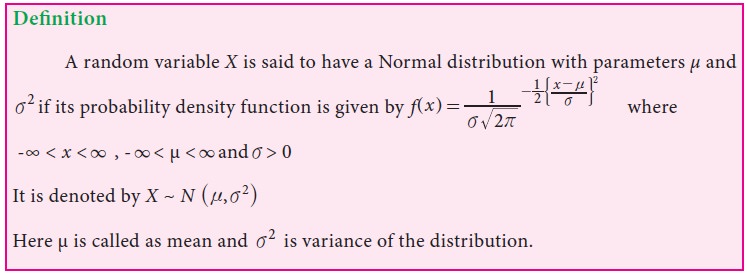
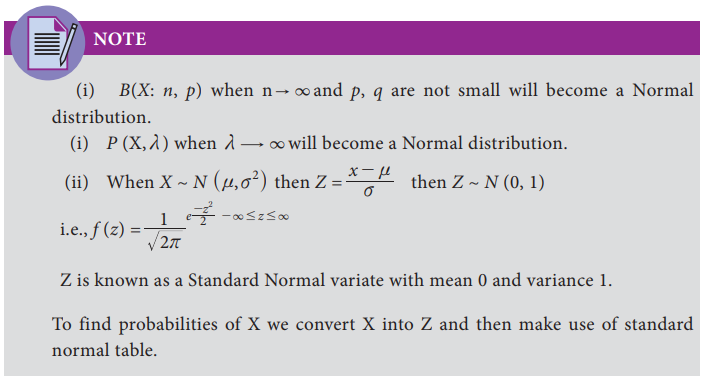
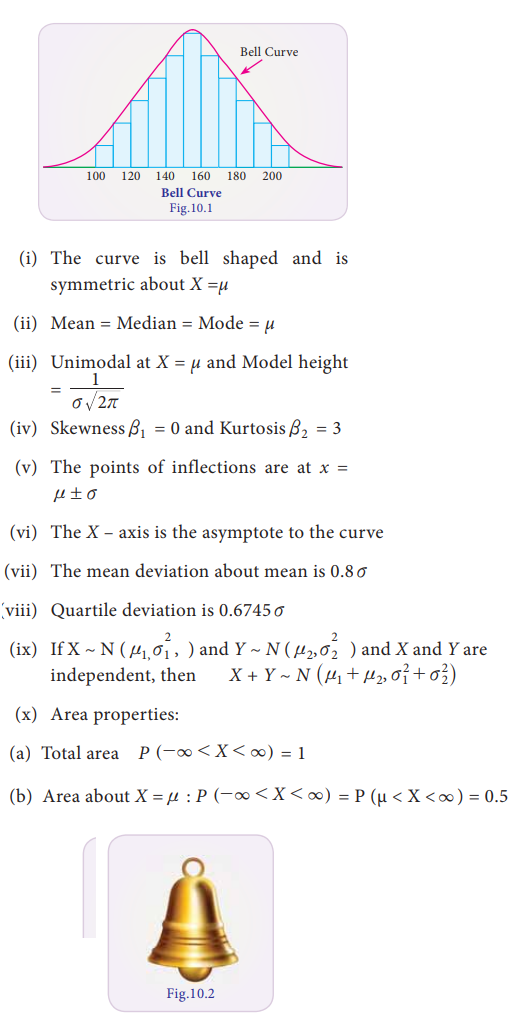
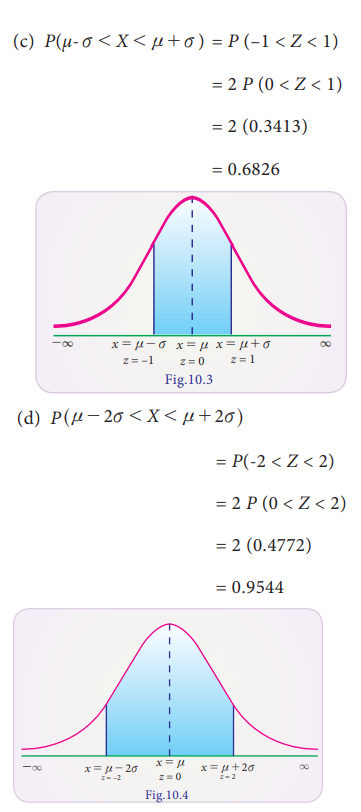
Properties of Normal Distribution
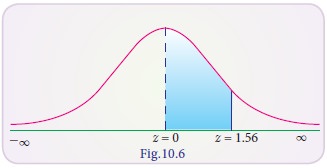
Example 10.22
Find
the area between z = 0 and z
= 1.56
Solution:
P (0 < Z < 1.56) = 0.4406
(from
the Normal Probability table)
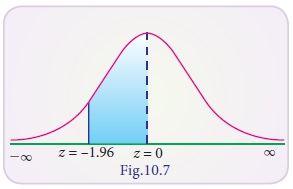
Example 10.23
Find the area of the Standard Normal variate from ŌĆō 1.96 to 0
Solution:
P (-1.96 < Z < 0)= P (0 < Z < 1.96)
(by symmetry)
= 0.4750 (from the Normal Probability table)
Example 10.24
Find the area to the right of Z = 0.25
Solution:
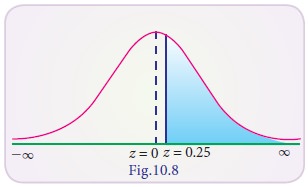
P
(Z > 0.25) = P (0 < Z < Ōł× ) ŌĆō P (0 < Z < 0.25)
= 0.5000 ŌĆō 0.0987 (from table)
= 0.4013
Example 10.25
Find the area to the left of Z
= 1.5
Solution:
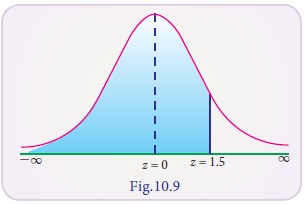
P
(Z < 1.5) = P (- Ōł×< Z < 0) + P(0< Z < 1.5)
=
0.5000 + 0.4332 (from table)
=
0.9332
Example 10.26
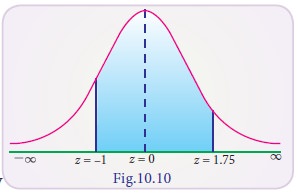
Find the area between Z = -1 and Z = 1.75
Solution:
P(-1 < Z < 1.75)
P (-1 < Z < 0) + P (0 < Z < 1.75)
= P (0 < Z < 1) + P (0 < Z < 1.75) by symmetry
= 0.3413 + 0.4599 = 0.8012
Example 10.27
Find the maximum value of the p.d.f of the Normal distribution
with mean 40 and standard derivation 10. Also find its points of inflection.
Solution:
╬╝ = 40
Žā=10
Maximum value = f (x)

Points of inflection = ╬╝┬▒Žā
= 40┬▒10
= 30 and 50
Example 10.28
A Normal variable X
has the mean 50 and the S.D 5. Find its mean deviation about mean and the
quartile deviation.
Solution:
Given Mean =╬╝=50 , standard
deviation Žā = 5
Mean deviation above mean = 0.8 Žā
= 0.8├Ś5 = 4
Quartile deviation = 0.6745Žā
= 0.6745├Ś5
= 3.3725
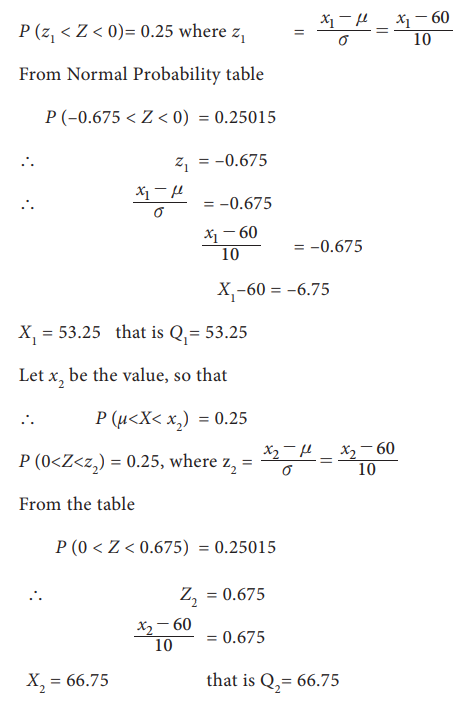
Example 10.29
Find the quartiles of the Normal distribution having mean 60 and
S.D 10.
Solution:
╬╝=60, Žā=10
Let x1 be the value such that the area from x1
to ╬╝ is 25%
` P (x1<X < ╬╝) = 25% = 0.25
Example 10.30
The height of the rose plants in a garden is Normally
distributed with a mean 100cms. Given that 10% of the plants have height
greater than104cm. Find (i) The S.D of the distribution (ii) The number of
plants have height greater than 105cms if there were 200 plants in the garden.
Solution:
The S.D of the distribution
Let X be the height of
the rose plants that is Normally distributed.
Given: P (100 < x < 104) =40 %
P ( 0< Z <4/Žā) = 0.40 ... (1)
But from table of area under Standard Normal curve
P ( 0< Z < 1.28 ) = 0.3997 ... (2)
From (1) and (2)
4/ Žā = 1.28
Žā = 3.125
(ii) The number of plants with height greater than 105 cms if
there were 200 plants in the garden.
X = 105
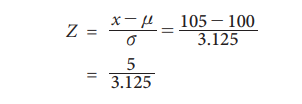
= 1.6
P(1.6 < Z < Ōł×) = 0.5-0.4452 = 0.0548
Number of plants = 200#0.0548 = 10.9600 Ōēł11
` 11 plants have height greater than 105cms.
Example 10.31
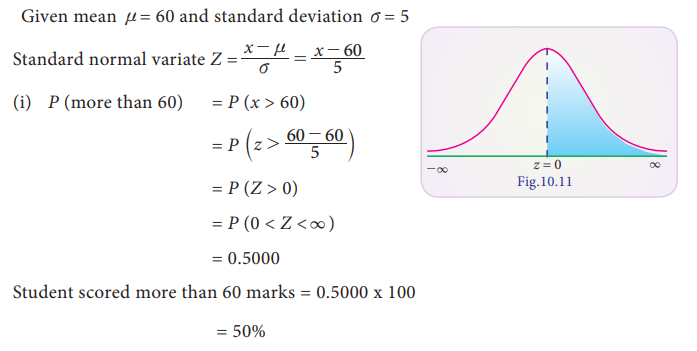
Students of a class were given an aptitude test. Their marks were
found to be normally distributed with mean 60 and standard deviation 5. What
percentage of students scored (i) more than 60 marks (ii) less than 56 marks
(iii) between 45 and 65 marks.
Solution:
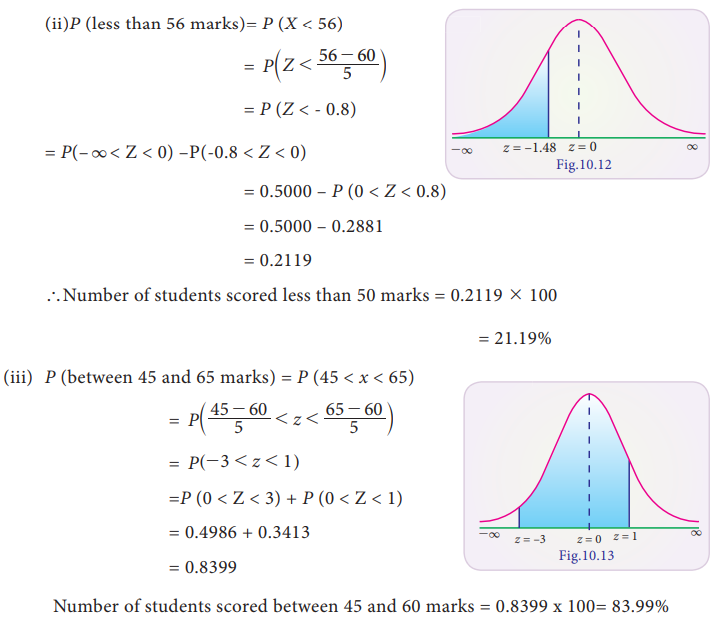
Number of students scored between 45 and 60 marks = 0.8399 x
100= 83.99%
Example 10.32
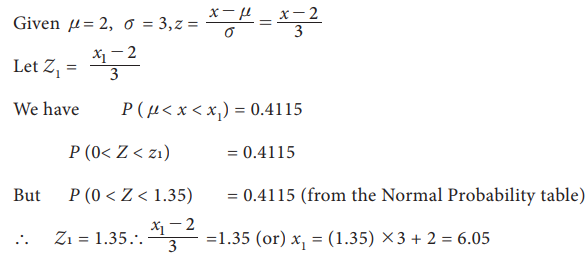
X has Normal
distribution with mean 2 and standard deviation 3. Find the value of the variable x such that the
probability of the interval from the mean to that value is 0.4115.
Solution:
Example 10.33
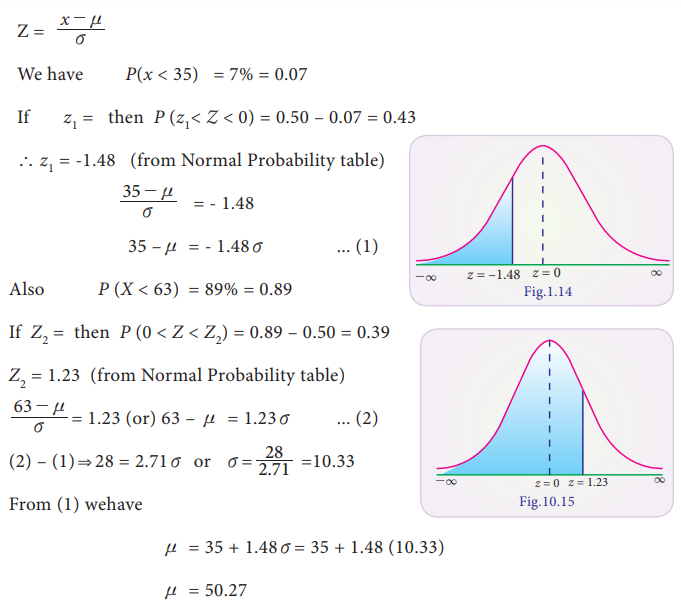
In a Normal distribution 7% items are under 35 and 89% are under
63. Find its mean and standard deviation.
Solution:
Related Topics