Chapter: 11th Statistics : Chapter 10 : Probability Distributions
Fitting of Binomial, Poisson and Normal distributions
Fitting
of Binomial, Poisson and Normal distributions
Introduction
Fitting of probability distribution to a series of observed data
helps to predict the probability or to forecast the frequency of occurrence of
the required variable in a certain desired interval.
There are many probability distributions of which some can be
fitted more closely to the observed frequency of the data than others,
depending on the characteristics of the variables. Therefore one needs to
select a distribution that suits the data well.
Fitting of Binomial Distribution
When a Binomial distribution is to be fitted to an observed data
the following procedure is adopted:-
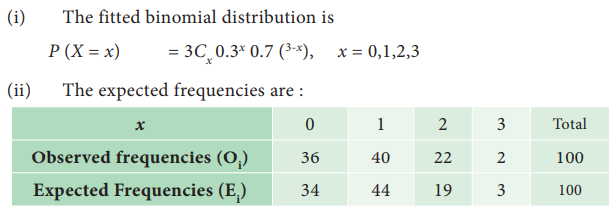
Example 10.34
A set of three similar coins are tossed 100 times with the
following results
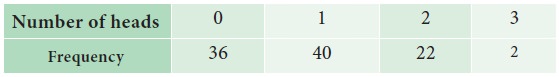
Fit a binomial distribution and estimate the expected
frequencies.
Solution :
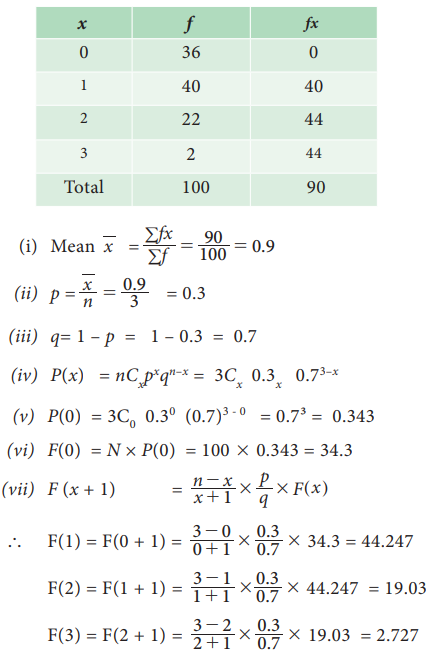
Solution :
Fitting of Poisson Distribution
When
a Poisson distribution is to be fitted to an observed data the following
procedure is adopted:
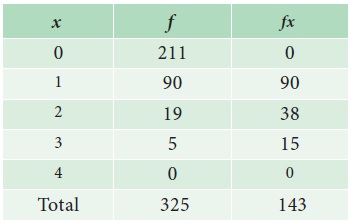
Example 10.35
The
following mistakes per page were observed in a book

Fit
a Poisson distribution and estimate the expected frequencies.
Solution:
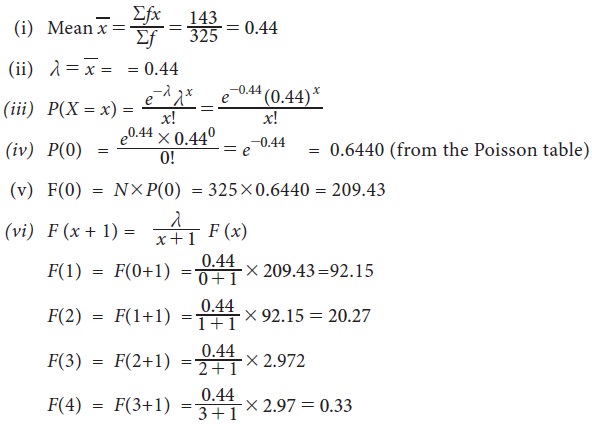
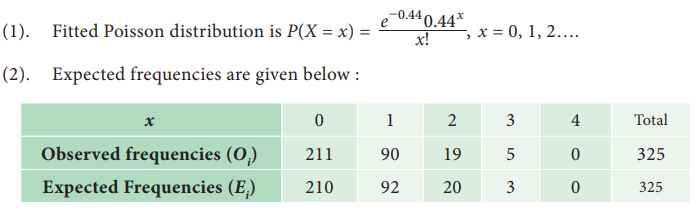
Result:
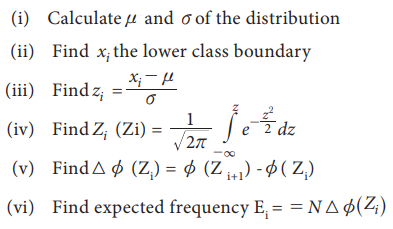
Fitting of Normal Distribution
In
fitting a Normal distribution to the observed data, given in class intervals,
we follow the following procedure:-
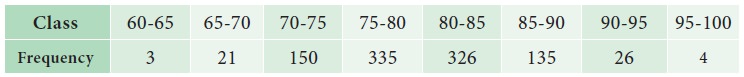
Example 10.36
Find
expected frequencies for the following data, if its calculated mean and standard
deviation are 79.945 and 5.545.
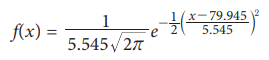
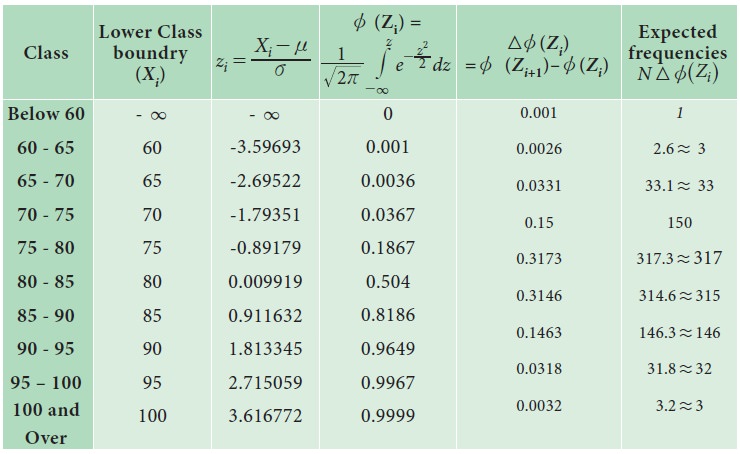
Solution:
Given
╬╝= 79.945, Žā = 5.545, and N = 1000
Hence the equation of Normal curve fitted to
the data is
Theoretical Normal frequencies can be obtained as follows:
Related Topics