Chapter: Civil : Remote Sensing Techniques and GIS : Data Entry, Storage and Analysis
Modeling In GIS Highway Alingment Studies
MODELING IN GIS HIGHWAY ALINGMENT STUDIES
Vector GIS displays the locations or all objects
stored using points and arcs.Attributes and entity types can be displayed by
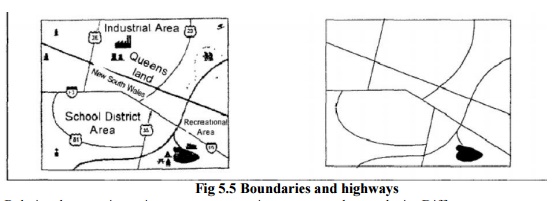
varying colors, line patterns and point symbols (Fig) . Using vector GIS, one
may display only a subset of the data. For example, one may select all
political boundaries and highways, but only areas that had urban land uses.

Fig 5.5
Boundaries and highways
Relational query is an important concept in vector
overlay analysis. Differentsystems use different ways of formulating queries.
Structured Query language (SQl) is used by many systems. It provides a "standard"
way in querying spatial data bases. Using relational queries, the user can
select objects interested in producing map output using colours, symbols, text
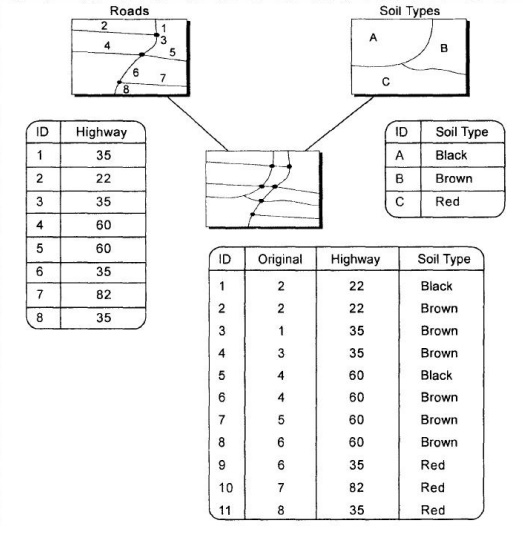
annotations and so on. Reclassify, dissolve, and merge operations are used
frequently in working with area objects. They are used to aggregate areas based
on attributes. Consider a soil map in Fig. We wish to produce a map of major
soil types from a layer that has polygons based on much more finely defined
classification scheme. To do this, we process the data using three steps: (i)
Reclassify areas by a single attribute or some combination; for instance
reclassify soil areas by soil type only (ii) Dissolve boundaries Lines are
broken at each area object boundary to form new line segments andnew attributes
created for each output line specifying the area it belongs to Fig.
A triangulated irregular network (TIN) is a
digital data structure used in a geographic information system (GIS) for the
representation of a surface. A TIN is a vector based representation of the
physical land surface or sea bottom, made up of irregularly distributed nodes
and lines with three dimensional coordinates (x,y, and z) that are arranged in
a network of nonoverlapping triangles. TINs are often derived from the
elevation data of a rasterized digital elevation model (DEM). An advantage of
using a TIN over a DEM in mapping and analysis is that the points of a TIN are
distributed variably based on an algorithm that determines which points are
most necessary to an accurate representation of the terrain. Data input is
therefore flexible and fewer points need to be stored than in a DEM with
regularly distributed points. While a TIN may be less suited than a DEM raster
for certain kinds of GIS applications, such as analysis of a surface's slope
and aspect, TINs have the advantage of being able to portray terrain in three
dimensions.
A TIN comprises a triangular
network of vertices, known as mass points, with associated coordinates in three
dimensions connected by edges to form a triangular tessellation.
Three-dimensional visualizations are readily created by rendering of the
triangular facets. In regions where there is little variation in surface
height, the points may be widely spaced whereas in areas of more intense
variation in height the point density is increased.
Characteristics
Contours should always point downridge along ridges Adjacent
contours should always be sequential or equivalent
Contours
should never split into two
Contours
should never cross or loop
Contours
should never spiral
Contours
should never stop in the middle of a map
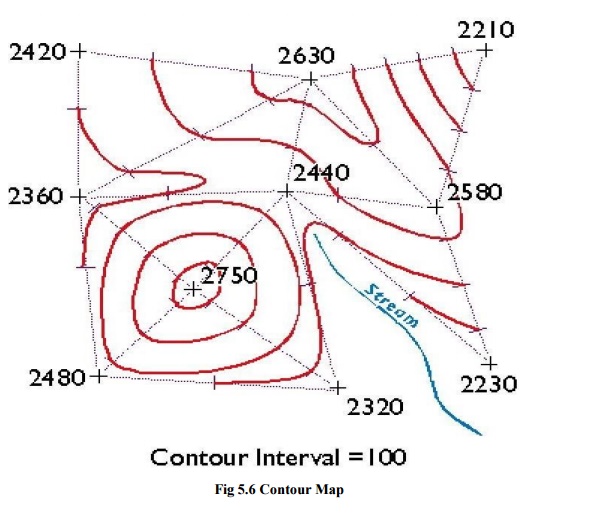
Fig 5.6 Contour Map
A streamlined approach is
developed for Land Information System to LIS thatincorporates key data into a
land registration structure, subsequently transferring them into a fully
automated information system. Under this approach, a land parcel is not stored
as a polygon or area in the LIS and hence is not used as the base framework for
the related database. Instead, a single point feature representing each
property is used as the identifier and geographic locator and are usually
termed as, "lots by dots." This is the critical difference from the
polygon-based approach which attempts to reconcile geometry and compile all
land parcels together into a contiguous map of polygons. This is practically
impossible to achieve even in the United States since individual surveys of
land parcels or 'lots' are often, not entirely accurate and do not actually
reconcile with one another.
This point-based property
database can be developed from hardcopy very highresolution satellite imagery
or aerial photographs, or through ground-based collection using Global
Positioning System (GPS) techniques. As the field person collects the geographic
(point) position of each land parcel the property identifier number as well as
physical characteristics of the land, such as, land cover, soil condition, and
number of structures can also be logged. This effectively allows an LIS
database to be built in the field during survey. Additional complementary data
can also be integrated into the LIS, such as, scanned property documents.
Related Topics