Chapter: Civil : Remote Sensing Techniques and GIS : Data Entry, Storage and Analysis
Data Input By Digitization Scanning
DATA INPUT BY DIGITIZATION SCANNING
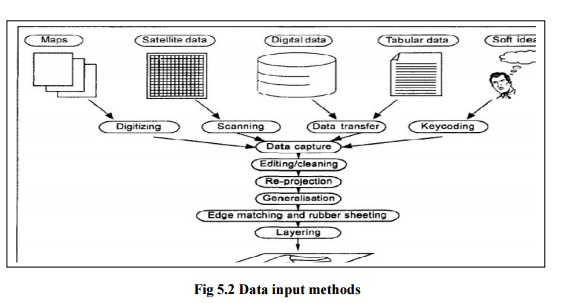
The data to be input for GIS are typically acquired in a diverse variety of forms.Some data come in graphic and tabular forms. These would include maps and photographs, records from site visits by specialists, related to non-spatial information from both printed and digital files (including descriptive information about the spatial data, such as date of compilation, and observational criteria). Other data come in digital form. These would include digital spatial data such as computer records of demographic or land ownership data, magnetic tapes containing information about topography and remotely sensed imagery. The data to be input for GIS are of different forms. These include key board entry or key coding, digitising, scanning and digital data. The process of data encoding and editing is often called as data stream.

1 DATA INPUT METHODS
Before explaining the input
methods, it is necessary to make a distinction between analogue (non-digital)
and digital sources of spatial data. Analogue data are normally in paper form
and include paper maps, tables of statistics and hardcopy aerial photographs.
All these forms of data need to be converted to digital form before use in a
GIS. Digital data like remote sensing data are already in compute-readable
formats and are supplied on diskette, magnetic tape or CD-ROM or across a
computer network. All data in analogue form need to be converted to digital
form before they can be input into GIS. There are four methods of data input
which are widely used: keyboard entry, manual digitising, automatic
digitisation, and scanning. Digital data must be downloaded from their source
media and may require reformatting to convert them to an appropriate format for
the GIS being used. Reformatting or conversionmay also be required after
analogue data have been converted to digital form. For example, after scanning
a paper map, the file produced by the scanning equipment may not be compatible
with the GIS, so it needs reformatting. For both the analogue anrJ digital
data, keyboard entry method, manual digitising and automatic digitizing and
scanning methods are very important as detailed below.
2 MANUAL DIGITISING
Manual digitising is the most common method of
encoding spatial features frompaper maps. It is a process of converting the
spatial features on a map into a digital format. Point, line, and area features
that form a map, are converted into (x, y) coordinates. A point is represented
by a single coordinate, a line by a string of coordinates, and, when one or
more lines are combined with a label point inside an outline, then an area
(polygon) is identified. Thus digitising is the process of capturing a series
of points and lines. Points are used for two different purposes: to represent
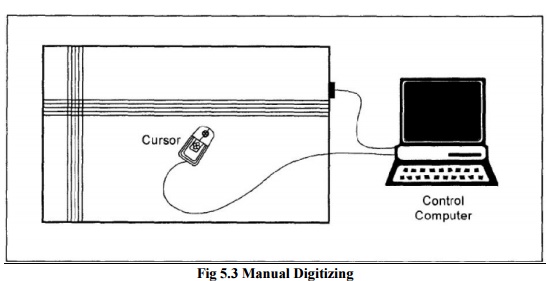
point features or to identify the presence of a polygon. Manual digitising
requires a table digitiser that is linked to a computer work station (Fig
10.2). To achieve good results, the following steps are necessary.
Before, discussing these steps, the description of digitisers is provided for
the beginners in this field of technology. Digitisers are the most common
device for extracting spatial information from maps and photographs. The
position of an indicator as it is moved over the surface of the digitizing
tablet is detected by the computer and interpreted as pairs of x, y
coordinates. The indicator may be a pen-like stylus or a cursor. Frequently,
there are control buttons on the cursor which permit control of the system
without having to turn attention from the digitising tablet to a
computer terminal. The current most popular digitiser is contemporary tablets
using a gird of wires embedded in the tablet to a generate magnetic field which
is detected by the cursor. The accuracy of such tables are typically better
than 0.1 mm which is better than the accuracy with which the average operator
can position the cursor. Sometimes the functions for transforming coordinates
are built into the tablet and used to process data before it is sent to the host.
3 THE DIGITIZING OPERATION
The map is affixed to a
digitizing table. Three or more control points are to be identified and
digitized for each map sheet. These points should be those that can be easily
identified like intersections of major streets and prominent landmarks. The
points are called reference points or tics or control points.
The coordinates of these control
points will be known in the coordinate system to be used in the final data,
such as, latitude and longitude. The control points are used by the system to
calculate the necessary mathematical transformations to convert all coordinates
to the final system. The more the control points, the better the accuracy of
digitisation. Digitising the map contents can be done in two different modes:
point mode and stream mode. Point mode is the mode in which the operator
identifies the points to be captured explicitly by pressing a button, and stream
mode is the mode in which points are captured at set time intervals,
typically 10 per second, or on movement of the cursor by filed distance. Most
digitizing is currently done in point mode.
Problems with Digitising Maps
The problems that come during the
process of converting the maps into digital mode through the process of
digitisation vary from one CAD operator to another. It depends upon the
experience and skill of the operator and density of points, lines and polygons
of the map. The accuracy of the output of the digitisation also depends upon
the selection and distribution of the control points. Some of the commonly
occurred problems during the digitisation of any paper map are as follows:
(i)
Paper maps are unstable; each time the map is
removed from the digitising table, the reference points must be re-entered when
the map is affixed to the table again.
(ii)
If the map has stretched or shrunk in the interim,
the newly digitised points will be slightly off in their location when compared
to previously digitised points.
(iii) Errors
occur on these maps, and these errors are entered into the GIS data base as
well.
(iv) The level
of error in the GIS database is directly related to the error level of the
source maps.
(v)Maps are meant to display
information, and do not always accurately record vocational information.
A digital image of
the map is produced by moving an electronic detector acrossthe map surface. The
size of the map area viewed by the detector and scanning should be processed or
edited to improve the quality and convert the raster to vector after online
digitisation. The accuracy of the scanned output data depends on the quality of
the scanner, the quality of the software used to process the scanned data, and
the quality of the source document. A very important feature that a GIS user
should observe after scanning the paper map is the occurrence of splines, which
is black appearance on the scanned output. This can be removed by using a
process called thinning.
The resolution of
the scanner used affects the quality and quantity of outputdata. The cheaper flat-bed scanners have
resolutions of 200-500 mm whereas the more expensive drum scanners use
resolutions of 10-50 mm. The higher the
resolution, the larger the volume of the data produced.
Scanning and Automatic Digitising
Scanning is the most
commonly used method of automatic digitising. Scanning is an appropriate method
of data encoding when raster data are required, since this is the automatic
output format from most scanning software. Thus scanning may be used as a background raster dataset for
the over-plotting of vector infrastructure data, such as, pipelines and cables.
A scanner is a piece of hardware Fig for converting an analogue
source document to a digital raster format (Jackson Woodsford, 1997). There are two types of scanners,
(i) Flatbed scanner and (ii) rotating drum scanners. The cheapest scanners are
small flatbed scanners, and high quality and large format scanners are rotating
drum scanners in which the sensor moves along the axis of rotation.
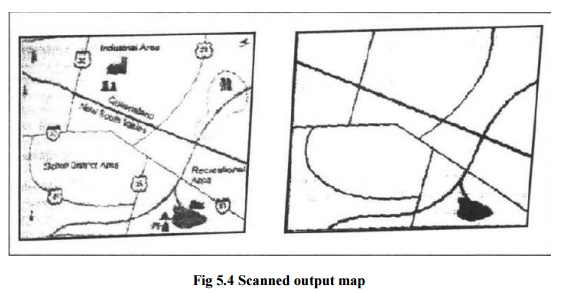
Fig 5.4
Scanned output map
Related Topics