Example Solved Problems - Methods of constructing seasonal indices | 12th Statistics : Chapter 7 : Time Series and Forecasting
Chapter: 12th Statistics : Chapter 7 : Time Series and Forecasting
Methods of constructing seasonal indices
Seasonal variation
Seasonal variations are fluctuations within a year over different
seasons.
Estimation of seasonal variations requires that the time series
data are recorded at even intervals such as quarterly, monthly, weekly or
daily, depending on the nature of the time series. Changes due to seasons,
weather conditions and social customs are the primary causes of seasonal
variations. The main objective of the measurement of seasonal variation is to
study their effect and isolate them from the trend.
Methods of constructing seasonal indices
There are four methods of constructing seasonal indices.
1. Simple averages method
2. Ratio to trend method
3. Percentage moving average method
4. Link relatives method
Among these, we shall discuss the construction of seasonal index
by the first method only.
Simple Averages Method
Under this method, the time series data for each of the 4 seasons
(for quarterly data) of a particular year are expressed as percentages to the
seasonal average for that year.
The percentages for different seasons are averaged over the years
by using simple average.
The resulting percentages for each of the 4 seasons then
constitute the required seasonal indices.
Method of calculating seasonal indices
(i) The data is arranged season-wise
(ii) The data for all the 4 seasons are added
first for all the years and the seasonal averages for each year is computed.
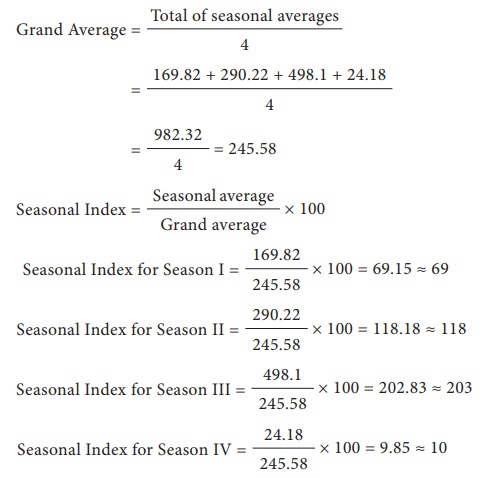
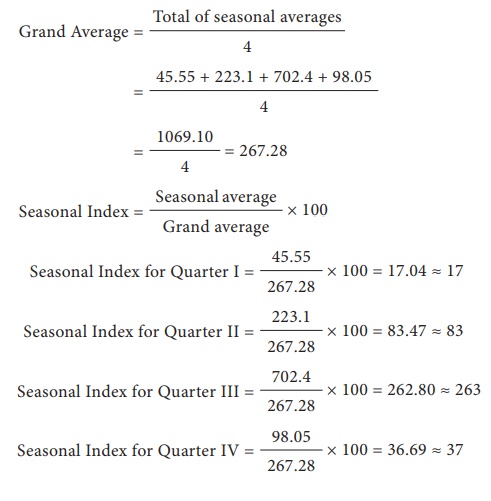
(iii) The average of seasonal averages is
calculated
(i.e., Grand average = Total of seasonal averages /number
of years).
(iv) The seasonal average for each year is divided by the
corresponding grand average and the results are expressed in percentages and
these are called seasonal indices.
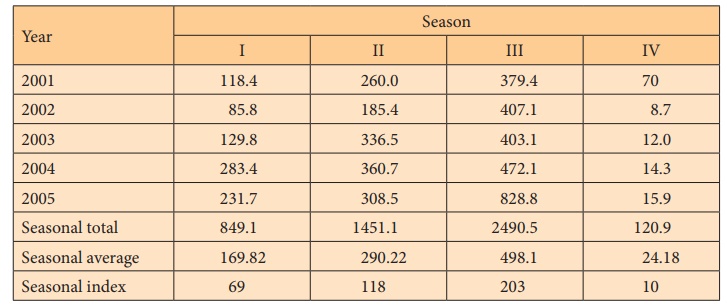
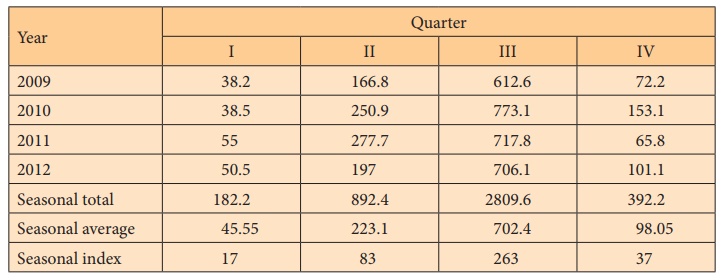
Example 7.9
Calculate the seasonal indices for the rain fall (in mm) data in
Tamil Nadu given below by simple average method
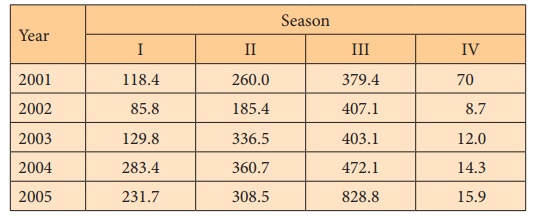
Solution:
Example 7.10
Obtain the seasonal indices for the rain fall (in mm) data in
India given in the following table.
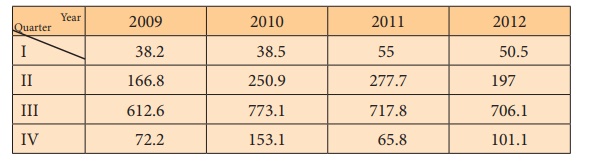
Solution:
Related Topics