Chapter: Software Testing : Controlling and Monitoring
Measurements and milestones for controlling and monitoring
Measurements and milestones for
controlling and monitoring
All
processes should have measurements (metrics) associated with them. The
measurements help to answer questions about status and quality of the process,
as well as the products that result from its implementation. Measurements in
the testing domain can help to track test progress, evaluate the quality of the
software product, manage risks, classify and prevent defects, evaluate test
effectiveness, and determine when to stop testing. Level 4 of the TMM calls for
a formal test measurement program. However, to establish a baseline process, to
put a monitoring program into place, and to evaluate improvement efforts, an
organization needs to define, collect, and use measurements starting at the
lower levels of the TMM.
To begin
the collection of meaningful measurements each organization should answer the
following questions:
• Which
measures should we collect?
• What is
their purpose (what kinds of questions can they answer)?
• Who will
collect them?
• Which
forms and tools will be used to collect the data?
• Who will
analyze the data?
• Who to
have access to reports?
When
these question have been addressed, an organization can start to collect simple
measurements beginning at TMM level 1 and continue to add measurements as their
test process evolves to support test process evaluation and improvement and
process and product quality growth. In this chapter we are mainly concerned
with monitoring and controlling of the testing process as defined in Section
9.0, so we will confine ourselves to discussing measurements that are useful
for this purpose. Chapter 11 will provide an in-depth discussion of how to
develop a full-scale measurement program applicable to testing. Readers will
learn how measurements support test process improvement and product quality
goals.
The following
sections describe a collection of measurements that support monitoring of test
over time. Each measurement is shown in italics to highlight it. It is
recommended that measurements followed by an asterisk (*) be collected by all
organizations, even those atTMMlevel 1. The reader should note that it is not
suggested that all of the measurements listed be collected by an organization.
TheTMMlevel, and the testing goals that an organization is targeting, affect
the appropriateness of these measures. As a simple example, if a certain degree
of branch coverage is not a testing objective for a organization at this time,
then this type of measurement is not relevant. However, the organization should
strive to include such goals in their test polices and plans in the future.
Readers familiar with software metrics concepts should note that most of the
measures listed in this chapter are mainly process measures; a few are product
measures. Other categories for the measures listed here are (i) explicit, those
that are measured directly from the process or product itself, and (ii)
derived, those that are a result of the combination of explicit and/or other
derived measures. Note that the ratios described are derived measures.
Now we
will address the question of how a testing process can be monitored for each
project. A test manager needs to start with a test plan. What the manager wants
to measure and evaluate is the actual work that was done and compare it to work
that was planned. To help support this goal, the test plan must contain testing
milestones as described in Chapter 7.
Milestones are tangible events that are expected to
occur at a certain time in the project’s lifetime. Managers use them to
determine project status.
Test
milestones can be used to monitor the progress of the testing efforts
associated with a software project. They serve as guideposts or goals that need
to be meet. A test manger uses current testing effort data to determine how
close the testing team is to achieving the milestone of interest. Milestones
usually appear in the scheduling component of the test plan (see Chapter 7).
Each level of testing will have its own specific milestones. Some examples of
testing milestones are:
• completion
of the master test plan;
• completion
of branch coverage for all units (unit test);
• implementation
and testing of test harnesses for needed integration of major subsystems;
• execution
of all planned system tests;
• completion
of the test summary report.
Each of
these events will be scheduled for completion during a certain time period in
the test plan. Usually a group of test team members is responsible for
achieving the milestone on time and within budget. Note that the determination
of whether a milestone has been reached depends on availability of measurement
data. For example, to make the above milestones useful and meaningful testers
would need to have measurements in place such as:
• degree of
branch coverage accomplished so far;
• number of
planned system tests currently available;
• number of
executed system tests at this date.
Test
planners need to be sure that milestones selected are meaningful for the
project, and that completion conditions for milestone tasks are not too
ambiguous. For example, a milestone that states ―unit test is completed when
all the units are ready for integration‖ is too
vague to use for monitoring progress. How can a test manager evaluate the
condition, ―ready‖? Because
of this ambiguous completion condition, a test manager will have difficulty
determining whether the milestone has been reached. During the monitoring
process measurements are collected that relates to the status of testing tasks
(as described in the test plan), and milestones. Graphs using test process data
are developed to show trends over a selected time period. The time period can
be days, weeks, or months depending on the activity being monitored. The graphs
can be in
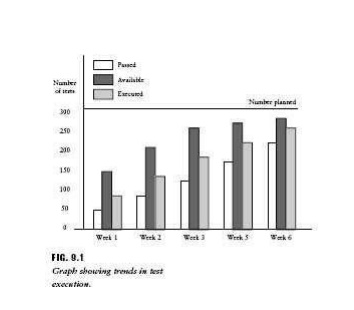
the form
of a bar graph as shown in Figure 9.1 which illustrates trends for test
execution over a 6-week period. They can also be presented in the form of x,y plots where the y-axis would be the number of tests and the x-axis would be the weeks elapsed from the start of the testing
process for the project. These graphs, based on current measurements, are
presented at the weekly status meetings and/or at milestone reviews that are
used to discuss progress. At the status meetings, project and test leaders
present up-to-date measurements, graphs and plots showing the status of testing
efforts.
Testing
milestones met/not met and problems that have occurred are discussed. Test
logs, test incident reports, and other test-related documents may be examined
as needed. Managers will have questions about the progress of the test effort.
Mostly, they will want to know if testing is proceeding according to schedules
and budgets, and if not, what are the barriers. Some of the typical questions a
manager might ask at a status meeting are:
Have all
the test cases been developed that were planned for this date?
• What
percent of the requirements/features have been tested so far?
• How far
have we proceeded on achieving coverage goals: Are we ahead or behind what we
scheduled?
• How many
defects/KLOC have been detected at this time?Howmany repaired? How many are of
high severity?
• What is
the earned value so far? Is it close to what was planned (see Section 9.1.3)?
• How many
available test cases have been executed? How many of these were passed?
•
How much of the allocated testing budget has been
spent so far? Is it more or less than we estimated?
How productive
is tester X? How many test cases has she developed? How many has she run? Was
she over, or under, the planned amount?
The
measurement data collected helps to answer these questions. In fact, links
between measurements and question are described in the Goals/ Questions/Metrics
(GQM) paradigm reported by Basili [2]. In the case of testing, a major goal is to monitor and control testing
efforts (a maturity goal at TMM level 3). An organizational team
(developers/testers, SQA staff, project/test managers) constructs a set of
likely questions that test/project
managers are likely to ask in order to monitor and control the testing process.
The sample set of questions previously described is a good starting point.
Finally, the team needs to identify a set of measurements that can help to answer these questions. A sample set
of measures is provided in the following sections. Any organizational team can
use them as a starting point for selecting measures that help to answer
testrelated monitoring and controlling questions. Four key items are
recommended to test managers for monitoring and controlling the test efforts
for a project. These are:
(i) testing
status;
(ii)
tester productivity;
(iii)testing
costs;
(iv)errors, faults, and failures.
In the
next sections we will examine the measurements required to track these items.
Keep in mind that for most of these measurements the test planner should
specify a planned value for the measure in the test plan. During test the
actual value will be measured during a specific time period, and the two then
compared.
Measurements for Monitoring Testing Status
Monitoring
testing status means identifying the current state of the testing process. The
manager needs to determine if the testing tasks are being completed on time and
within budget. Given the current state of the testing effort some of the
questions under consideration by a project or test manager would be the
following:
• Which
tasks are on time?
• Which
have been completed earlier then scheduled, and by how much?
• Which are
behind schedule, and by how much?
• Have the
scheduled milestones for this date been meet?
• Which
milestones are behind schedule, and by how much?
The
following set of measures will help to answer these questions. The test status
measures are partitioned into four categories as shown in Figure 9.2. A test
plan must be in place that describes, for example, planned coverage goals, the
number of planned test cases, the number of requirements to be tested, and so
on, to allow the manager to compare actual measured values to those expected
for a given time period.
1. Coverage Measures
As test
efforts progress, the test manager will want to determine how much coverage has
been actually achieved during execution of the tests, and how does it compare
to planned coverage. Depending on coverage goals for white box testing, a
combination of the following are recommended.
Degree of statement, branch, data
flow, basis path, etc., coverage (planned, actual)* Tools can support the gathering of this
data. Testers can also use ratios such as:
Actual degree of coverage/planned degree of
coverage to monitor coverage to date. For black
box coverage the following measures can be useful:
Number of requirements or features to be tested* Number of equivalence classes identified
Number of equivalence classes actually covered
Number or degree of requirements or features
actually covered*
Testers
can also set up ratios during testing such as:
Number of features actually covered/total number of
features*
This will
give indication of the work completed to this date and the work that still
needs to be done.
Test Case Development
The
following measures are useful to monitor the progress of test case development,
and can be applied to all levels of testing. Note that some are explicit and
some are derived. The number of
estimated
test cases described in the master test plan is:
Number of planned test cases
The
number of test cases that are complete and are ready for execution is:
Number of available test cases
In many
cases new test cases may have to be developed in addition to those that are
planned. For example, when coverage goals are not meet by the current tests,
additional tests will have to be designed. If mutation testing is used, then
results of this type of testing may require additional tests to kill the
mutants. Changes in requirements could add new test cases to those that were
planned. The measure relevant here is:
Number of unplanned test cases
In place
of, or in addition to, test cases, a measure of the number planned, available,
and unplanned test procedures is often used by many organizations to monitor
test status.
Test Execution
As
testers carry out test executions, the test manager will want to determine if
the execution
process is
going occurring to
plan. This next
group of measures
is appropriate.
Number of available test cases executed*
Number of available tests cases executed and passed*
Number of unplanned test cases executed
Number of unplanned test cases executed and passed.
For a new
release where there is going to be regression testing then these are useful:
Number of planned regression tests executed
Number of planned regression tests executed and
passed
Testers
can also set up ratios to help with monitoring test execution. For example:
Number of available test cases executed/number of
available test cases
Number of available test cases executed/number of
available test cases executed and passed
These
would be derived measures.
Test Harness Development
It is
important for the test manager to monitor the progress of the development of
the test harness code needed for unit and integration test so that these
progress in a timely manner according to the test schedule. Some useful
measurements are:
Lines of Code (LOC) for the test harnesses (planned,
available)*
Size is a
measure that is usually applied by managers to help estimate the amount of
effort needed to develop a software system. Size is measured in many different
ways, for example, lines of code, function points, and feature points. Whatever
the size measure an organization uses to measure its code, it can be also be
applied to measure the size of the test harness, and to estimate the effort
required to develop it. We use lines of code in the measurements listed above
as it is the most common size metric and can be easily applied to estimating
the size of a test harness. Ratios such as:
Available LOC for the test harness code/planned LOC
for the test harnesses are useful to monitor the test harness development effort over time.
Measurements to Monitor Tester Productivity
Managers
have an interest in learning about the productivity of their staff, and how it
changes as the project progresses. Measuring productivity in the software
development domain is a difficult task since developers are involved in many
activities, many of which are complex, and not all are readily measured. In the
past the measure LOC/hour has been used to evaluate productivity for
developers. But since most developers engage in a variety of activities, the
use of this measure for productivity is often not credible. Productivity
measures for testers have been sparsely reported. The following represent some
useful and basic measures to collect for support in test planning and
monitoring the activities of testers throughout the project. They can help a
test manger learn how a tester distributes his time over various testing
activities. For each developer/tester, where relevant, we measure both planned
and actual:
Time spent in test planning
Time spent in test case design* Time spent in test
execution* Time spent in test reporting Number of test cases developed*
Number of test cases executed*
Productivity
for a tester could be estimated by a combination of:
Number of test cases developed/unit time* Number of
tests executed/unit time*
Number of LOC test harness developed/unit time*
Number of defects detected in testing/unit time
The last
item could be viewed as an indication of testing efficiency. This measure could
be partitioned for defects found/hour in each of the testing phases to enable a
manager to evaluate the efficiency of defect detection for each tester in each
of these activities. For example:
Number of defects detected in unit test/hour
Number of defects detected in integration
test/hour, etc.
The relative
effectiveness of a tester in each of these testing activities could be
determined by using ratios of these measurements. Marks suggests as a tester
productivity measure [3]:
Number of test cases produced/week
All of
the above could be monitored over the duration of the testing effort for each
tester. Managers should use these values with caution because a good measure of
testing productivity has yet to be identified. Two other comments about these
measures are:
1.
Testers perform a variety of tasks in addition to designing and running test
cases and developing test harnesses. Other activities such as test planning,
completing documents, working on quality and process issues also consume their
time, and those must be taken into account when productivity is being
considered.
2.
Testers should be aware that measurements are being gathered based on their
work, and they should know what the measurements will be used for. This is one
of the cardinal issues in implementing a measurement program. All involved
parties must understand the purpose of collecting the data and its ultimate
use.
Measurements for
Monitoring Testing Costs
Besides
tracking project schedules, recall that managers also monitor costs to see if
they are being held within budget. One good technique that project managers use
for budget and resource monitoring is called earned value tracking. This
technique can also be applied to monitor the use of resources in testing. Test
planners must first estimate the total number of hours or budget dollar amount
to be devoted to testing. Each testing task is then assigned a value based on
its estimated percentage of the total time or budgeted dollars. This gives a
relative value to each testing task, with respect to the entire testing effort.
That value is credited only when the task is completed. For example, if the
testing effort is estimated to require 200 hours, a 20-hour testing task is
given a value of 20/200*100 or 10%. When that task is completed it contributes
10% to the cumulative earned value of the total testing effort. Partially
completed tasks are not given any credit. Earned values are usual presented in
a tabular format or as a graph. An example will be given in the next section of
this chapter. The graphs and tables are useful to present at weekly test status
meetings.
To
calculate planned earned values we need the following measurement data:
Total estimated time or budget for the overall
testing effort
Estimated time or budget for each testing task
Earned
values can be calculated separately for each level of testing. This would
facilitate monitoring the budget/resource usage for each individual testing
phase (unit, integration, etc.). We want to compare the above measures to:
Actual cost/time for each testing task*
We also
want to calculate:
Earned value for testing tasks to date
and
compare that to the planned earned value for a specific date. Section 9.2 shows
an earned value tracking form and contains a discussion of how to apply earned
values to test tracking. Other measures useful for monitoring costs such as the
number of planned/actual test procedures (test cases) are also useful for
tracking costs if the planner has a good handle on the relationship
between
these numbers and costs (see Chapter 7). Finally, the ratio of:
Estimated costs for testing/Actual costs for
testing can be applied to a series of releases or related projects to evaluate and promote more accurate test cost
estimation and higher test cost effectiveness through test process improvement.
Measurements for Monitoring Errors , Faults , and Failures
Monitoring
errors, faults, and failures is very useful for:
• evaluating
product quality;
• evaluating
testing effectiveness; making stop-test decisions;
defect
casual analysis;
• defect
prevention;
• test
process improvement;
• development
process improvement.
Test
logs, test incident reports, and problem reports provide test managers with
some of the raw data for this type of tracking. Test managers usually want to
track defects discovered as the testing process continues over time to address
the second and third items above. The other items are useful to SQA staff,
process engineers, and project managers. At higher levels of the TMM where
defect data has been carefully stored and classified, mangers can use past defect
records from similar projects or past releases to compare the current project
defect discovery rate with those of the past. This is useful information for a
stop-test decision (see Section 9.3). To strengthen the value of defect/failure
information, defects should be classified by type, and severity levels should
be established depending on the impact of the defect/failure on the user. If a
failure makes a system inoperable it has a higher level of severity than one
that is just annoying. A example of a severity level rating hierarchy is shown
in Figure 9.3.
Some
useful measures for defect tracking are:
Total number of incident reports (for a
unit, subsystem, system)*
Number of incident reports resolved/unresolved (for
all levels of test)* Number of
defects found of each given type*
Number of defects causing failures of severity
level greater than X found (where X is an appropriate integer value)
Number of defects/KLOC (This is called the defect
volume. The division by KLOC normalizes the defect count)*
Number of failures*
Number of failures over severity level Y (where Y
is an appropriate integer value) Number of defects repaired*
Estimated number of defects (from historical data)
Other
failure-related data that are useful for tracking product reliability will be
discussed in later chapters.
Monitoring Test Effectiveness
To
complete the discussion of test controlling and monitoring and the role of test
measurements we need to address what is called test effectiveness. Test
effectiveness measurements will allow managers to determine if test resources
have been used wisely and productively to remove defects and evaluate product
quality. Test effectiveness evaluations allow managers to learn which testing
activities are or are not productive. For those areas that need improvement,
responsible staff should be assigned to implement and monitor the changes. At
higher levels of the TMM members of a process improvement group can play this
role. The goal is to make process changes that result in improvements to the
weak areas. There are several different views of test effectiveness. One of
these views is based on use of the number of defects detected. For example, we
can say that our testing process was effective if we have successfully revealed
all defects that have a major impact on the users. We can make such an
evaluation in several ways, both before and after release.
1. Before release. Compare the numbers of
defects found in testing for this software product to the number expected from
historical data. The ratio is:
Number of defects found during test/number of
defects estimated
This will
give some measure of how well we have done in testing the current software as
compared to previous similar products. Did we find more or fewer errors given
the test resources and time period? This is not the best measure of
effectiveness since we can never be sure that the current release contains the
same types and distribution of defects as the historical example.
2. After release. Continue to collect
defect data after the software has been released in the field. In this case the
users will prepare problem reports that can be monitored. Marks suggests we use
measures such as ―field fault density‖ as a
measure of test effectiveness. This is equal to:
Number of defects found/thousand lines of new and
changed code. This measure is applied to new releases of the
software. Another measure suggested
is a ratio of:
Pre-ship fault density/Post-ship fault density .
This
ratio, sometimes called the ―defect removal efficiency,‖ gives an indication of how many
defects remain in the software when it is released. As the testing process
becomes more effective, the number of predelivery defects found should increase
and postdelivery defects found should fall. The value of the postship fault
density (number of faults/KLOC) is calculated from the problem reports returned
to the development organization, so testers need to wait until after shipment
to calculate this ratio. Testers must examine the problem reports in detail
when using the data.
There may
be duplicate reports especially if the software is released to several
customers. Some problem reports are due to misunderstandings; others may be
requests for changes not covered in the requirements. All of these should be
eliminated from the count. Other measurements for test effectiveness have been
proposed. For example,:
Number of defects detected in a given test
phase/total number of defects found in testing.
For
example, if unit test revealed 35 defects and the entire testing effort
revealed 100 defects, then it could be said that unit testing was 35%
effective. If this same software was sent out to the customer and 25 additional
defects were detected, then the effectiveness of unit test would then be
25/125, or 20%. Testers can also use this measure to evaluate test
effectiveness in terms of the severity of the failures caused by the defects.
In the unit test example, perhaps it was only 20% effective in finding defects
that caused severe failures. The fault seeding technique as described in
Section 9.3 could also be applied to evaluate test effectiveness. If you know
the number of seeded faults injected and the number of seeded faults you have
already found, you can use the ratio to estimate how effective you have been in
using your test resources to date. Another useful measure, called the ―detect
removal leverage (DRL)‖
described in Chapter 10 as a review measurement, can be applied to measure the
relative effectiveness of: reviews versus test phases, and test phases with
respect to one another. The DRL sets up ratios of defects found. The ratio
denominator is the base line for comparison. For example, one can compare:
DRL
(integration/unit test) _ Number of defects found integration test Number of
defects found in unit test
Section
10.7 gives more details on the application of this metric. The costs of each
testing phase relative to its defect detecting ability can be expressed as:
Number of
defects detected in testing phase X Costs of testing in testing phase X
Instead
of actual dollar amounts, tester hours, or any other indicator of test resource
units could also be used in the denominator. These ratios could calculated for
all test phases to compare their relative effectiveness. Comparisons could lead
to test process changes and improvements. An additional approach to measuring
testing effectiveness is described by Chernak [8]. The main objectives of
Chernak‘s research are (i) to show how to determine if a set of test cases (a
test suite) is sufficiently effective in revealing defects, and (ii) to show
how effectiveness measures can lead to process changes and improvements. The
effectiveness metric called the TCE is defined as follows:
Number of
defects found by the test cases TCE _Total number of defects _ 100
The total
number of defects in this equation is the sum of the defects found by the test
cases, plus the defects found by what Chernak calls side effects. Side effect
are based on so-called ―testescapes.‖ These
are software defects that a test suite does not detect but are found by chance
in the testing cycle.
Test
escapes occur because of deficiencies in the testing process. They are
identified when testers find defects by executing some steps or conditions that
are not described in a test case specification. This happens by accident or
because the tester gets a new idea while performing the assigned testing tasks.
Under these conditions a tester may find additional defects which are the
test-escapes. These need to be recorded, and a casual analysis needs to be done
to develop corrective actions. The use of Chernak‘s metric depends on finding
and recording these types of defects. Not all types of projects are candidates
for this type of analysis. From his experience, Chernak suggests that
client-server business applications may be appropriate projects. He also
suggests that a baseline value be selected for the TCE and be assigned for each
project.
When the
TCE value is at or above the baseline then the conclusion is that the test
cases have been effective for this test cycle, and the testers can have some
confidence that the product will satisfy the uses needs. All test case escapes,
especially in the case of a TCE below the specified baseline, should be studied
using Pareto analysis and Fishbone diagram techniques (described in Chapter
13), so that test design can be improved, and test process deficiencies be
removed. Chernak illustrates his method with a case study (a client-server
application) using the baseline TCE to evaluate test effectiveness and make
test process improvements. When the TCE in the study was found to be below the
baseline value (_ 75 for this case), the organization analyzed all the
test-escapes, classified them by cause, and built a Pareto diagram to describe
the distribution of causes.
Incomplete
test design and incomplete functional specifications were found to be the main
causes of test-escapes. The test group then addressed these process issues,
adding both reviews to their process and sets of more ―negative‖ test cases to improve the
defect-detecting ability of their test suites.The TMM level number determined
for an organization is also a metric that can be used to monitor the testing
process. It can be viewed as a high-level measure of test process
effectiveness, proficiency, and overall maturity. A mature, testing process is
one that is effective. The TMM level number that results from a TMM assessment
is a measurement that gives an organization information about the state of its
testing process. A lower score on theTMMlevel number scale indicates a less
mature, less proficient, less effective testing process state then a
higher-level score. The usefulness of the TMM level number as a measurement of
testing process strength, proficiency, and effectiveness is derived not only
from its relative value on the TMM maturity scale, but also from the process
profile that accompanies the level number showing strong and weak testing
areas. In addition, the maturity goals hierarchy give structure and direction
to improvement efforts so that the test process can become more effective.
Related Topics