Mathematical Methods for Economics - Information and Communication Technology (ICT) | 11th Economics : Chapter 12 : Mathematical Methods for Economics
Chapter: 11th Economics : Chapter 12 : Mathematical Methods for Economics
Information and Communication Technology (ICT)
Information
and Communication Technology (ICT)
Information
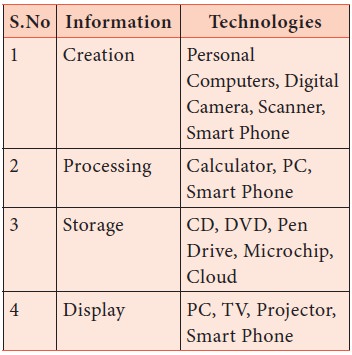
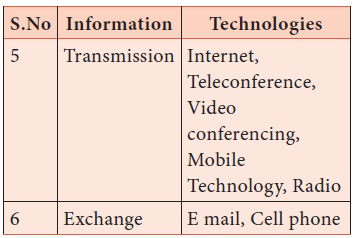
and Communication Technology (ICT) is the infrastructure that enables computing
faster and accurate. The following table gives an idea of range of technologies
that fall under the category of ICT.
The
evaluation of ICT has five phases. They are evolution in
a.
Computer
b.
PC
c.
Microprocessor
d.
Internet and
e.
Wireless links
In
Economics, the uses of mathematical and statistical tools need the support of
ICT for data compiling, editing, manipulating and presenting the results. In
general, SPSS and Excel packages are often used by researchers in economics.
Such Software is designed to do certain user tasks.Word processor, spread sheet
and web browser are some of the examples which are frequently used while
undertaking analysis in the study of economics.
1. MS Word
MS word
is a word processor, which helps to create, edit, print and save documents for
future retrieval and reference.
The features of word processor are
a.
Document can be created, copied, edited and
formatted.
b.
Words and sentences can be inserted, changed or
deleted.
c.
Formatting can be applied.
d.
Margins and page size can be adjusted.
e.
Spell check can be availed.
f.
Multiple documents – files can be merged.
How to open a word Document?
One can
open MSWord from various options.
Click
start → All program → MS word or Double click the MS word icon from the
desktop.
Uses of Menu
Home menu
→ It is used to change the fonts, font size, change the text color and apply
text style bold, italic, underline etc.
Insert →
It is used to insert page numbers, charts, tables, shapes, word art forms,
equations, symbols and pictures.
Page
Layout → It is used to change the margin size, split text into more columns,
background colour of a page.
Reference
→ Insert table of authors, endnote, footnote
Review →
Spell check, Grammar, Translate.
View →
Print layout, full screen reading, document view
2. Microsoft Office Excel
It is
used in data analysis by using formula. A spread sheet is a large sheet of paper
which contains rows and columns. The intersection of rows and columns is termed
as ‘cell’. MS Excel 2007 version supports up to 1 million rows and 16 thousand
columns per work sheet.
Start
You can
start excel from various options.
·
Click Start → Program → Micro Soft Excel.
·
Double Click the MS Excel Icon from the Desk top.
Work Sheet
A
worksheet is a table like document containing rows and columns with data and
formula. There are four kinds of calculation operators. They are arithmetic,
comparison, text concatenation (link together) and reference. MS Excel helps to
do data analysis and data presentation in the form of graphs, diagrams, area
chart, line chart etc.
3. Microsoft Power Point
It is a
software used to perform computer based presentation.
Steps
involved in making presentation:
i.
Click Start Menu
ii.
Click Program
iii.
Select Microsoft Power point – Click.
iv.
New Power Point file will open, and then type the
title and subtitle if wanted.
v.
A new slide can be inserted by ‘click’ on icon ‘new
slide’ or using short key ‘Ctrl + M’
vi.
We can type the content, insert the table,
pictures, movies, sounds, etc., with the content.
vii.
Tab ‘Design’ helps to design the slides (can select
common design for all slides or separate slide for each slide)
viii.
Click icon slide show, one can run slide show
either starting from the first slide or starting from the current slide.
The power
point presentation (PPT) facilitates the key points to be kept in memory and
understand the particular topic. Recently, the smart class room teaching uses
the PPT to deliver the information in an effective way to enhance the quality
of teaching.
Think and Do
Make a Document with MS word on “Incredible India”.
Prepare an Excel Sheet for your daily pocket expenses for each category/item in last month
Prepare and present a “Power Point” for “Day out with your
parents”
Related Topics