Chapter: Pharmaceutical Drug Analysis: Atomic Absorption Spectroscopy
Important Aspects of Atomic Absorption Spectroscopy
IMPORTANT ASPECTS OF ATOMIC ABSORPTION SPECTROSCOPY
The following three
important aspects of atomic absorption spectroscopy shall be discussed here
briefly, namely :
(i) Analytical
Techniques,
(ii) Detection
Limit and Sensitivity, and
(iii)
Interferences.
1. ANALYTICAL TECHNIQUES
In atomic absorption spectroscopy (AAS) the technique
using calibration curves and the standard addition method are both equally suitable for the quantitative
determinations of elements.
1.1. Calibration Curves
Theoretically, the absorbance must be proportional to
concentrations, however, deviations from lin-earity usually take place.
Therefore, it is necessary to prepare an empirical
calibration curve (ECC). For this, the standard solutions of the element(s)
to be determined are employed to plot the ECC from which the contents in the ‘test solutions’ may be measured
conveniently.
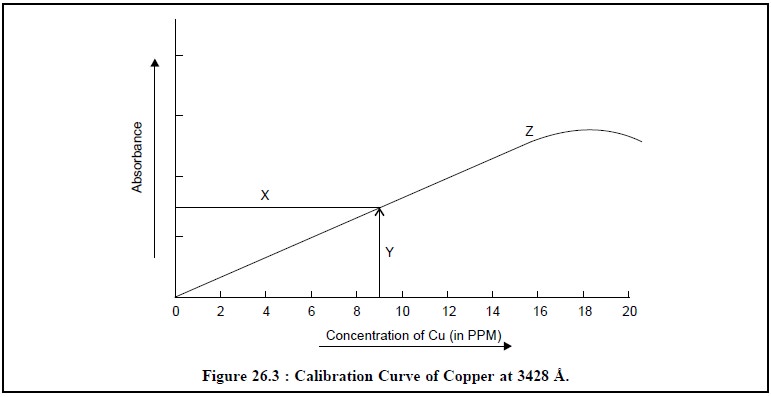
Figure 26.3, represents the typical calibration curves of
copper at 3428 Å, where :
X = Sample absorption reading,
Y = Sample concentration reading, and
Z = Calibration curve.
It is quite evident from the calibration curve (Z) in
Figure 26.3, that the linearity between the concen-tration of Cu (in ppm) and
absorbance prevails over the range 2.0 to 10.0 ppm specifically, whereas at
higher concentrations the said relationship does not hold good anymore. Hence,
it is pertinent to mention here that whenever the quantitative analysis of an
element is to be carried out, the absorbance is preferably measured almost
under the same experimental parameters whereby the calibration curve was
initially constructed.
1.2. Standard Addition Method
The standard
addition method is widely employed in AAS. In this case, two more aliquots
of the sample are transferred to volumetric flasks. The first, is diluted to
volume, and the absorbance of the solution is measured. The second, receives a
known quantity of analyte, whose absorbance is also measured after dilution to
the same volume. Likewise, data for other standard additions may also be
obtained.
If a plot between absorbance and concentration reveals a
linear relationship, which may be accom-plished by several stepwise standard
additions, the following expressions hold good, namely :
AX = k
CX …………………………(a)
AT = k
(CS + CX) …………………………(b)
where, CX = Analyte concentration in the diluted sample,
CS = Contribution of the added standard to the
concentration, and
AX and AT = Measured absorbances of
CX and CS.
Combining Eqs. (a)
and (b) we have :
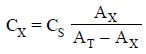 ..........................(c)
When a number of stepwise additions are performed, AT
can be plotted against CX. Thus, the resulting straight line may be
extrapolated to AT = 0. By substituting this value in Eq. (c) we may have at the intercept :
 ...........................(d)
Advantage : The major plus points of the
standard addition method is that it tends to compensate for variations caused by physical and chemical interferences in the
sample solution.
2. DETECTION LIMIT AND SENSITIVITY
Detection Limit : It may be defined as the
concentration (meg ml–1) of an element that gives rise in the shifting of absorbance signal to
an amount which equals to the peak-to-peak noise of the base-line.
Sensitivity : It may be defined as the
concentration of element present in the sample solution that produces 1% absorption.
From the above definition it is quite evident that the
sensitivity takes no cognizance of the noise-level of the base-line, therefore,
it is more or less of no use as a definite guide to the least quantity of an
element which may be estimated. However, the sensitivity of a 1% absorption-is
a pure theoretical number only that would undergo a change solely depending on
the efficiency of the lamp (hollow-cathode-lamp), atomizer, flame-system
employed, monochromator (prism, grating used), and finally the photomultiplier
used.
The sensitivity for 1% absorbance is determined by the
help of the expression given below :
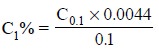
where,
C1% = Concentration that yields 1% absorption,
and
C0.1 = Concentration that yields an absorption
of 0.1
Sensitivity is usually expressed in terms of mcg ml–1
for 1% absorbance.
It is an usual practice to perform an actual-test-run
over a sufficiently large range by employing the necessary prevailing expansion
facility so as to ascertain fully whether or not the atomic absorption
tech-nique is reasonably applicable to a specific low-level estimation. Such a
data may ultimately reveal the exact and true detection limit which is normally
equals to twice the noise level.
3. INTERFERENCES
In general, atomic absorption methods are subject to three types of interferences, namely :
(i) Spectral
Interferences,
(ii) Chemical
Interferences, and
(iii)
Ionisation Interferences.
The different interferences shall be discussed briefly
below :
3.1 Spectral Interferences
This type of interference normally takes place when the
absorption of an interfering species either overlaps or lies very near to the
analyte absorption, with the result that resolution by the monochromator almost
becomes impossible, Hollow-cathode-source invariably give rise to extremely
narrow emission-lines, hence interference caused due to overlap of atomic
spectral lines is rather rare.
A few typical examples of spectral interferences are
given below :
(a) Spectral
interferences caused either by the combustion products which show broad-band
absorp-tion or the particulate products which scatter radiation. In fact, both
these products distinctly lower the power of the transmitted beam of light and
ultimately give rise to positive analytical errors.
Remedy
(a) When the
source of the combustion or particulate products is the full and oxidant
mixture alone, then a blank is aspirated into the flame and the necessary
corrections are effected from the observed absorbances.
(b) Spectral
interferences may be produced due to an emission line of another element,
radical or molecule and also by unresolved band spectra. Here, the lines are
read together proportionately to the extent of overlap if the spectral band
after passing through the monochromator allows the undersired radiation to
reach the photoreceptor finally.
For instance : Manganese triplet (at 4031°,
4033° and 4035° A) : potassium doublet (at 4044° and 4047° A) and the gallium line (at 4033° A).
Remedy : The overlapping of this nature
may be eliminated either by prior chemical separation or by selection other spectral lines.
(c) Sample Matrix : A relatively more
complex and troublesome problem is usually faced when the source of scattering
originates right in the sample matrix itself. In such a situation, it has been
noticed that the power of the transmitted beam-designated as P, is reduced by
the nonanalyte components, whereas the incident beam power-designated as Po, is
not ; thereby resulting in a positive error in absorbance and hence in
concentration.
Example : Determination of Barium in
alkaline-earth mixtures affords a potential matrix interference due to absorption. It has been
observed that an intense and useful absorption line for barium atoms, occurring
at 553.6 nm, lies in the centre of a broad absorption band for Ca (OH)2,
that extends from 540 to 560 nm.
Remedy : (1) The effect due to sample
matrix is quickly and effectively eliminated by replacing nitrous oxide for air as the oxidant for the acetylene, whereby
the higher temperature completely decomposes the Ca (OH)2 and
eliminates the absorption band.
(2) If the source of interference is known, an excess of
the interfering substance may be added to the sample as well as the standards ;
provided the ‘excess’ is sufficient enough with respect to the concentration
from the sample matrix, the concentration of the latter will thus become
insignificant. Such an added sub-stance is sometimes referred to as a radiation
buffer.
3.2. CHEMICAL INTERFERENCES
In usual practice, the chemical interferences are found
to be more common than the spectral interfer-ence. However, their effects may
very often be minimized by appropriate choice of experimental parameters.
Examples : (i) Chemical Interferences
due to Anion (PO43–) : Phosphate ions have been found
to interfere with determination of
Mg and Ca by AAS. The absorption due to Mg and Ca are appreciably weaker in the
presence of PO43– ions than in their absence. This is
evidently on account of the formation of fairly stable phosphates of Mg and Ca
which do not readily split-up into the respective atoms in the mantle of a
flame.
Remedy : The addition of an excess of
strontium (Sr), or lanthanum (La), or thorium (Th) ion remark-ably minimizes
the interference of PO43– ion in the determination of Mg,
and Ca by replacing the analyte in the analyte in the compound formed with the
respective interfering species. In short, these ions do combine preferentially
with PO43– ions.
(ii) Chemical Interference due to Cations :
In certain specific cases cations also interfere in atomic absorption
measurements, for instance : Boron interferes with Mg and Ca ; whereas
aluminium interferes with alkaline earth elements.
Protective Agents : These agents are found to
inhibit the interferences by virture of their ability to form relatively stable but volatile species with the respective
analyte. There are three reagents
that are em-ployed commonly for this purpose, namely :
(a)
Ethylenediaminetetra-acetic acid (EDTA).
(b)
8-Hydroxyquinoline, and
(c) Ammonium
salt of 1-pyrrolidinecarbodithioic acid (APDC). EDTA helps to eliminate the
inter-ferences of Al3, Si4+, PO43–
and SO42– in the determination of Ca.
3.3. Ionization Interferences
It has been observed that the ionization of atoms or
molecules is comparatively very small in magni-tude in combustion mixtures
which essentially involve air as the oxidant and, therefore, may be ignored and
neglected. Consequently, the substitution of air with either oxygen or nitrous
oxide, however, gives rise to temperatures which are high enough to cause
appreciable ionization., Hence, as a consequence of the at-tained equilibrium-a
fairly significant concentration of electron exists as shown below :
where, M = Neutral atom or molecule,
M+ = Its corresponding ion, and
e– = An electron
Hence, if the medium has the species B in addition to
species M, and if the former ionizes according to the following equation :
then the extent of ionization of the latter will be
minimized substantially be the Law of
Mass Action of the electrons originated from the former species (i.e., B).
Example : The intensity of atomic
absorption lines for the alkali metals, such as : potassium (K) ; rubidium (Rb) ; and caesium (Cs), is
found to be affected by temperature in a complex way. Under certain
experimental parameters a noticeable decrease in absorption may be observed in
hotter flames. Hence, lower excitation temperatures are invariably recommended
for the analysis of alkali metals.
Remedy : The resulting effects of
shifts in ionization equilibrium may be eliminated effectively by the addition of an ionization
suppressor, that promptly gives a comparatively high concentration of electrons
to the flame. This ultimately results in the suppression of ionization by the
respective analyte.
Related Topics