Chapter: Medical Electronics : Electro-Physiology and Bio-Potential Recording
Electrocardiography(ECG)
ELECTROCARDIOGRAPHY (ECG)
·
A very widely used medical instrument, which is utilized
to diagnose and monitor cardiac beat abnormalities, is the electrocardiograph.
·
It measures the electrical activity of the heart
(more precisely biopotential differences arising from the electrical activity
of myocardium). We’ve already talked about the genesis of the ECG signal.
·
The ECG machine uses surface electrodes and high
input impedance
·
Differential amplifiers with good common mode
rejection ratio to record the electrocardiogram
·
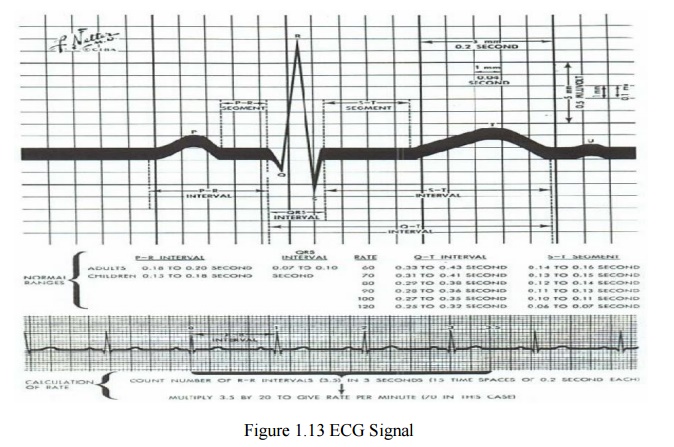
Normal ECG amplitude ranges between 0.5-4 mV.
Normal frequency content of ECG (for diagnostic purposes) is 0.05-100 Hz. A
typical ECG waveform is shown below:
Significant diagnostic features of the ECG signal
are:
·
Duration of component parts of the signal
·
Polarities and magnitudes
·
The details of the ECG signal and the degree of
variability in different parts of the ECG signal is shown below:
·
The QRS amplitude, polarity, time duration, the RR
interval (indicator of heartbeat per min.) and the T-wave amplitude are some
very important and distinctive features of the ECG signal.
·
The heart rate in BPM = Beats Per Minute) is simply
= 60 (RR interval in seconds)
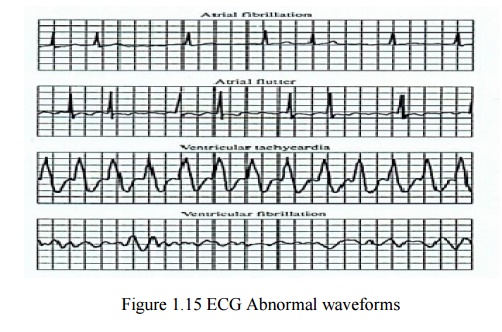
Some ECG waveform abnormalities that may indicate
illness are:
·
An extended PR interval may be diagnosed as AV node
block
·
A widening of the QRS complex may indicate
conduction problems in the bundle of His
·
An elevated ST segment may indicate occurrence of
myocardial Infarction (MI)
·
A negative polarity in the T wave may be due to
coronary insufficiency
1. ECG Leads
A Normal
ECG recording for the standard lead connections leads I, II and III (Lead II
provides the strongest signal)
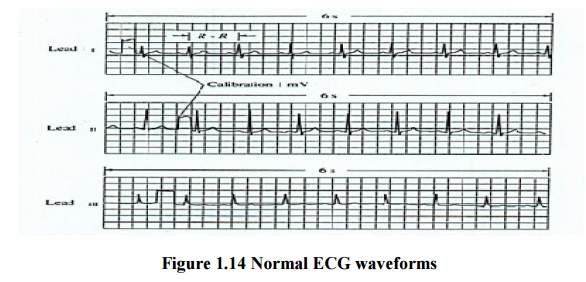
Obviously,
all human hearts are not the same and this results into a high degree of variability.
Some
abnormalities that may indicate illness:
·
An extended P-R interval may be diagnosed as AV node block
·
Widening of the QRS complex conduction problems in
the bundle of His
·
Elevated ST segment may indicate occurrence of MI
·
Negative polarity T wave may be due to coronary
insufficiency QRS amplitude, polarity, time domain, PR interval (indicator of
heat beat per min. & T-wave amplitude are some very important.
Distinctive features.
1.Loss
2. Origin of the ECG signal
·
We have already covered this concept extensively in
the previous lectures (The Dipole filed of the heart, the Eindhoven’s Triangle,
the electrical circuit model for the electrocardiographic problem, etc.)
Standard Limb Leads (I, II, III)
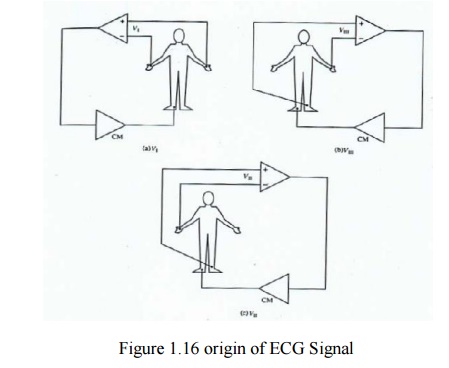
·
The lead wires are color-coded according to some
conventions. One example is: White – RA (Right Arm), Black – LA (Left Arm),
Green – RL (Right Leg), Red – LL (Left Leg), and Brown – C (Chest)
Augmented Limb Leads
·
These leads offer a free 50% increase over leads
VR, VL, and VF connections (unipolar leads) with respect to Wilson terminal AVR
= -I – III/2, AVL = I – II/2, aVF = II – I/2
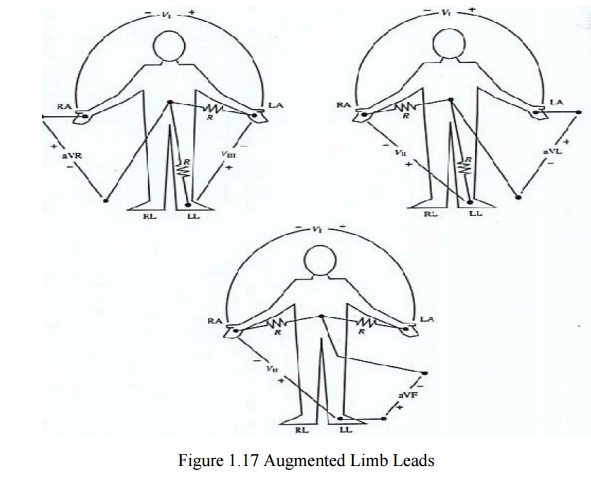
Each
measurement is made from the reflected limb and the average of the other two
limbs.
2. The ECG Machine
Most
representative Specs:
• Zin = 10
MΩ
• Frequency
response = 0.05 –100 Hz
• Strip
Chart Recorder Speed = 25 mm/sec.
• Fast
Speed = 100 mm/sec.
For
detailed Specs. Refer to the Table in your text “Summary of performance
requirements for electrocardiographs”
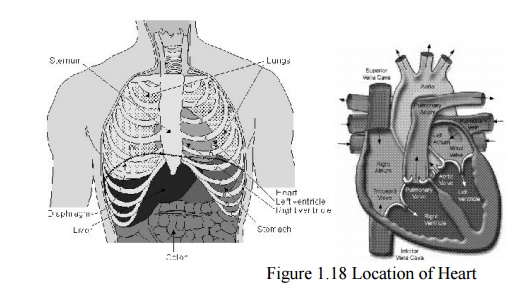
Location of the Heart
•
The heart is located between the lungs behind the
sternum and above the diaphragm.
•
It is surrounded by the pericardium.
•
Its size is about that of a fist, and its weight is
about 250-300 g.
•
Its center is located about 1.5 cm to the left of
the midsagittal plane.
Anatomy of the heart
•
The walls of the heart are composed of cardiac
muscle, called myocardium.
•
It consists of four compa rtments:
– the right and left atria and ventricles
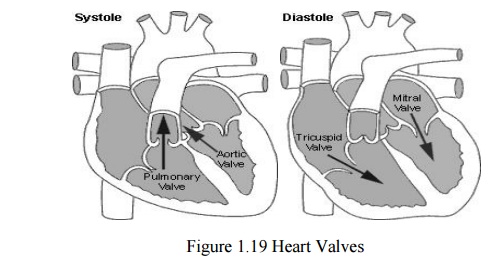
The Heart Valves
•
The tricuspid valve regulates blood flow between
the right atrium and right ventricle.
•
The pulmonary valve c ontrols blood flow from the
right ventricle into the pulmonary arteries
•
The mitral valve lets oxygen-rich blood from your
lungs pass from the left atrium into the left ventricle.
•
The aortic valve lets oxygen-rich blood pass from
the left ventricle i nto the aorta, then to the body.
Blood circulation via heart
•
The blood returns from the systemic circulation to
the right atrium and from there goes through the tricuspid valve to the right
ventricle.
•
It is ejected from the rig ht ventricle through the
pulmonary valve to t he lungs.
•
Oxygenated blood return s from the lungs to the
left atrium, and from there through the mitral valve to the left ventricle.
•
Finally blood is pump ed through the aortic valve
to the aort a and the systemic circulation.
Electrical activation of the heart
•
In the heart muscle cell, or myocyte, electric activation takes place b y means of the same mechanism
as in the nerve cell, i.e., from the inflow of Na ions across the cell
membrane.
•
The amplitude of the action potential is also
similar, being 100 mV for both nerve and muscle
•
The duration of the card iac impulse is, however,
two orders of magnitude longer than in either nerve cell or sceletal muscle
cell.
•
As in the nerve cell, repolarization is a
consequence of the outflow of K ions.
•
The duration of the action impulse is about 300 ms
Mechanical contraction of Cardiac Muscle
•
Associated with the electric activation of cardiac muscle cell is its
mechanical
•
contraction, which occurs a little later.
An important distinction between cardiac
muscle tissue and skeleetal muscle is that in cardiac muscle, activatiion can
propagate from one cell to another in any direction.
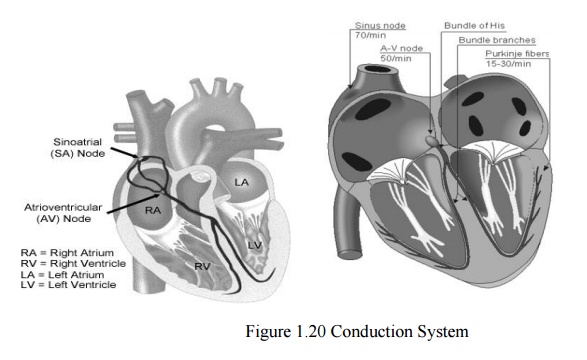
• Electrical
signal begins in the sinoatrial (SA) node: "natural pacemaker."
causes the atria to contract.
•
The signal then passes through the atrioventricular
(AV) node.
– sends the signal t o the ventricles via the
“bundle of His”
– Causes the ventricles to contract.
The Conduction System
The Action Potential
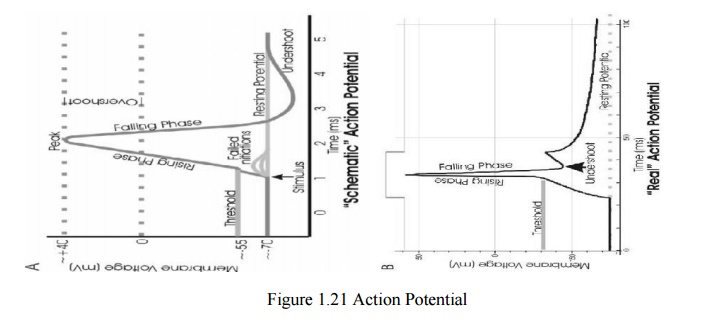
Recording an AP requires the isolation of a single
cell.
· Microelectrodes (with t ips a few μm across)
are used to stimulate and record the response. A typical AP i s 2-4ms long with
an amplitude of about 100 Mv
Related Topics