Geography - Division of the world on the basis of Economic Activies | 12th Geography : Chapter 4 : Economic Activities
Chapter: 12th Geography : Chapter 4 : Economic Activities
Division of the world on the basis of Economic Activies
Division of the world on
the basis of Economic Activies
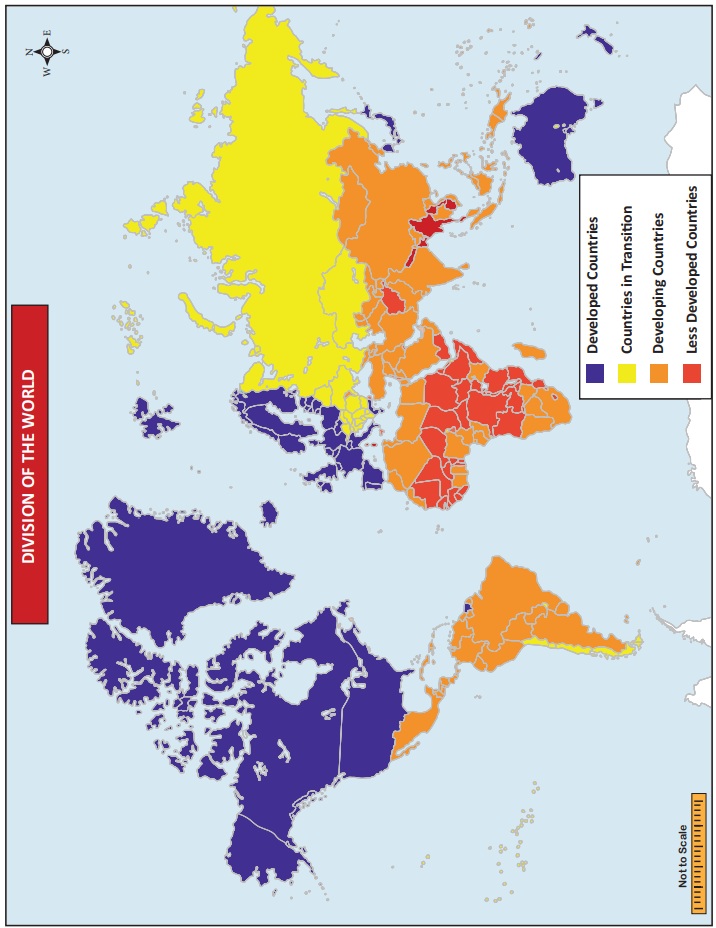
For analytical purposes, World Economic
Situation and Prospects classifies (WESP) all countries of the world into one of
three broad categories: developed countries,
countries in transition (South-Eastern
Europe Commonwealth of Independent States
and Georgia) less developed countries.
The classification of countries is based
on the economic status such as Gross Domestic Product (GDP), Gross National Product
(GNP), per capita income, industrialization, the standard of living, etc. Developed
Countries refer to the sovereign state, whose economy has highly progressed and
possess great technological infrastructure, as compared to other nations.
Developed countries
A developed country, industrialized country,
more developed country, or more economically developed country (MEDC), is a country
that has a developed economy and advanced technological infrastructure relative
to other less industrialized nations. Most commonly, the criteria for evaluating
the degree of economic development are gross domestic product (GDP), gross national
product (GNP), the per capita income, level of industrialization, amount of widespread
infrastructure and general standard of living.
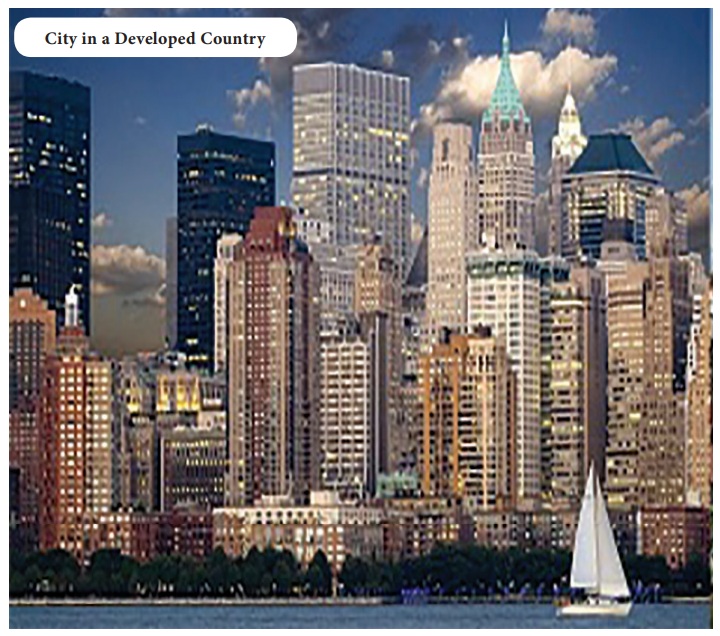
Developed countries have generally post-industrial
economies, meaning the service sector provides more wealth than the industrial sector.
As of 2015, advanced economies comprise 60.8% of global GDP based on nominal values
and 42.9% of global GDP based on purchasing-power parity (PPP) according to the
International Monetary Fund. In 2017, the ten largest advanced economies by GDP
in both nominal and PPP terms were Australia, Canada, France, Germany, Italy, Japan,
South Korea, Spain, the United Kingdom, and the United States.
Countries in transition
A country in transition economy or transitional
economy is an economy which is changing from a centrally planned economy to a market
economy. Transition economies undergo a set of structural transformations intended
to develop market-based institutions. These include economic liberalization, where
prices are set by market forces rather than by a central planning organization.
The process has been applied in the former Soviet Union and Eastern bloc countries
of Europe and some Third world countries, and detailed work has been undertaken
on its economic and social effects.
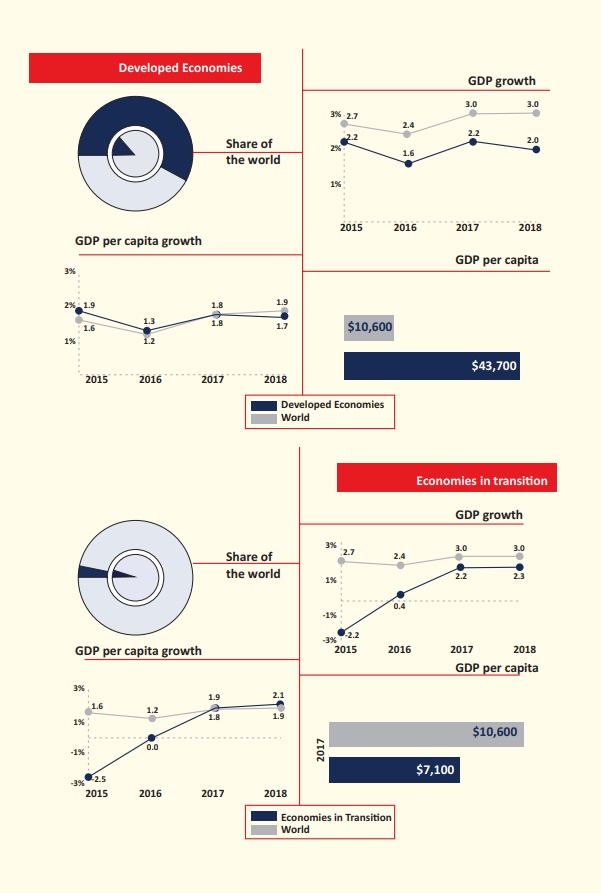
The Least Developed Countries
The Least Developed Countries is a list of countries that, according to
the United Nations, exhibit the lowest indicators of socioeconomic development,
with the lowest Human Development Index ratings of all countries in the world. A
country is classified among the Least Developed Countries if it meets three criteria.
* Poverty
– adjustable criterion based on GNI per capita averaged over three years. As of
2018 a country must have GNI per capita less than US$1,025 to be included on the
list, and over $1,230 to graduate from it.
* Human resource weakness (based on indicators of nutrition, health, education and adult literacy).
* Economic vulnerability (based on instability
of agricultural production, instability of exports of goods and services, economic
importance of non-traditional activities, merchandise export concentration, handicap
of economic smallness, and the percentage of population displaced by natural disasters).
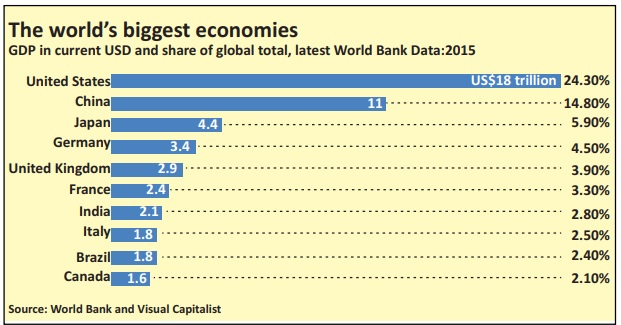
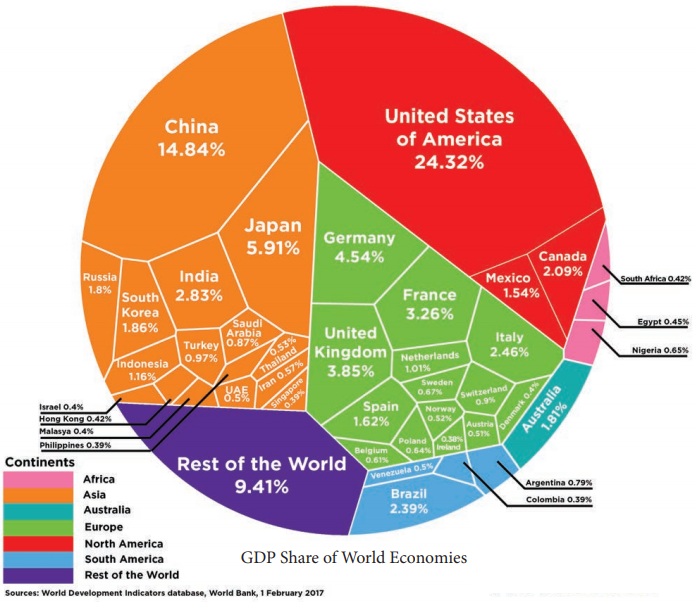
The world’s 10 biggest economies in 2015
The economy of the United States is the largest in the world.
At $18 trillion, it represents a quarter
share of the global economy (24.3%), according to the latest World Bank figures.
China
follows, with $11 trillion, or 14.8% of the
world economy. Japan is in third place with an economy of $4.4 trillion, which represents almost 6% of the world economy. European
countries take the next three places on the list: Germany in fourth position, with a $3.3 trillion economy; the United
Kingdom in fifth with $2.9 trillion;
and France in sixth with $2.4 trillion. India is in seventh place with $2.1
trillion, and Italy in eighth with an
economy of over $1.8 trillion. Ninth
place goes to Brazil, with an almost
$1.8 trillion economy. And in 10th is
Canada, with an economy of over $1.6 trillion. The economy of the United
States is larger than the combined economies of numbers three to 10 on the list.
Fastest-growing economy
Although China trails the US by $7 trillion,
it’s catching up. China’s economy grew by 6.7% in 2016, compared with America’s
1.6%, according to the IMF. It has also overtaken India as the fastest-growing large
economy. The IMF’s World Economic Outlook estimated China’s economy grew at 6.7%
in 2016, compared with India’s 6.6%. The chart above shows the world’s 40 biggest
economies individually, but grouped by colour into continents. The Asian bloc clearly
has a larger share than anywhere else, representing just over a third (33.84%) of
global GDP. That’s compared to North America, which represents just over a quarter,
at 27.95%. Europe comes third with just over one-fifth of global GDP (21.37%). Together,
these three blocs generate more than four-fifths (83.16%) of the world’s total output.
Related Topics