Indian Economy - Development Indicators | 11th Economics : Chapter 8 : Indian Economy Before and After Independence
Chapter: 11th Economics : Chapter 8 : Indian Economy Before and After Independence
Development Indicators
Development
Indicators
1. Human Development Index (HDI)
United
Nations Development Programme has been publishing Human Development Report
annually since 1990. HDI helped the government to the real uplifting of
standard of living of the people.
Human Development Index (HDI)
HDI was developed by the Pakistani Economist Mahbub ul Haq and
the Indian Economist Amartya Kumar Sen in 1990 and was published by the United
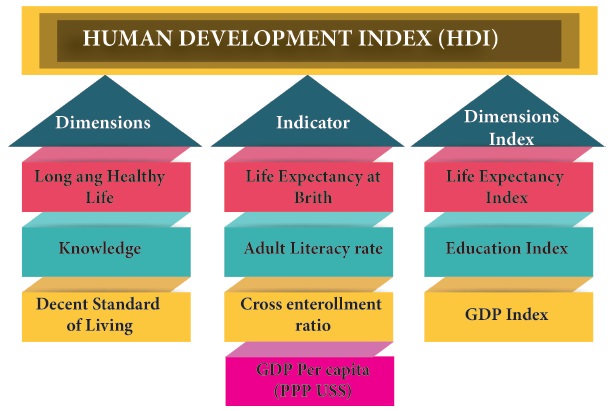
Nations Development Programme (UNDP). It is constructed based on Life
Expectancy Index, Education Index and GDP Per Capita.
HDI is
based on the following three indicators
1. Longevity
is measured by life expectancy at birth,
2. Educational
attainments,
3. Standard
of living, measured by real GDP per capita (PPP$).
Before
calculating HDI, the fixed minimum and maximum values of each indicator are
chosen.
The
performance in each dimension is expressed as a value between 0 and 1 by
applying the following formula
Dimension
Index = (Actual value – Minimum value) / (Maximum value - Minimum value)
According
to Planning Commission’s National Human Development Report 2011, HDI has
improved significantly between 1980 and 2011. That is, The HDI went up from
0.302 in 1981 to 0.472 score in 2011.
As per
latest Human Development Report (2016) by the United Nations Development
Programme (UNDP), India has been ranked 131st out of 188 countries. Out of 188
countries, India lies in Medium Human
The other nations such as Bangladesh, Bhutan, Pakistan, Kenya, Myanmar
and Nepal attained the medium human development. The HDR 2016 stated that
regional disparities in education, health and living standards within India has
caused India’s downfall to 27 % on HDI score. India’s HDI rank value in 2015
stood at 0.624, which had increased from 0.580 in 2010. India’s rank in 2014
was 131.
Top three countries of HDI
Norway (0.949)
Australia (0.939)
Switzerland (0.939)
Biswajeet Guha has stated that the calculation of HDI neglected many important aspects of human development. He has created four indices of HDI as HDI1, HDI2, HDI3, and HDI4. HDI1 is based on UNDP methodology as given in Human Development Report. He has enlarged the scope of HDI by adding three more dimensions such as quality of life, poverty eradication, and urbanization.

Various
countries including India are continuously making efforts to improve and
enlarge the scope of available statistical information.
2. Physical Quality of Life Index (PQLI)
Morris D
Morris developed the Physical Quality of Life Index (PQLI). The PQLI is a
measure to calculate the quality of life (well being of a country). For this,
he included three indicators such as life expectancy, infant mortality rate and
literacy rate. A scale of each indicator ranges from the number 1 to 100.
Number 1
represents the worst performance by any country. 100 is the best performance.
For example, in case of life expectancy, the upper limit of 100. This was
assigned to 77 years which was achieved by Sweden in 1973. The lower limit of 1
was assigned to 28 years which was achieved by Guinea-Bissau in 1960.
The main
difference between the two is the inclusion of income in HDI and exclusion of
income from PQLI. HDI represents both physical and financial attributes of
development and PQLI has only the physical aspects of life.
Related Topics