Chapter: The Diversity of Fishes: Biology, Evolution, and Ecology: Conservation and the future of fishes
Commercial exploitation - General causes of fish biodiversity decline
Commercial exploitation
Direct exploitation of fishes by humans is an obvious cause of fish population declines. However, humans are just one of many predators on most smaller fishes, and species or populations subject to predation generally possess compensatory mechanisms for sustaining predation losses (see Population dynamics and regulation).
Predation by humans, however, has extraordinary characteristics. Most “natural” predators focus their activities on young individuals, which tend to be the most abundant cohorts within a population, or on sick individuals with little reproductive potential, or on old individuals that have already reproduced. Human fisheries are at best indiscriminate (e.g., trawl and purse seine fisheries); at worst they target larger individuals that have not spawned (e.g., oceangoing salmonids).
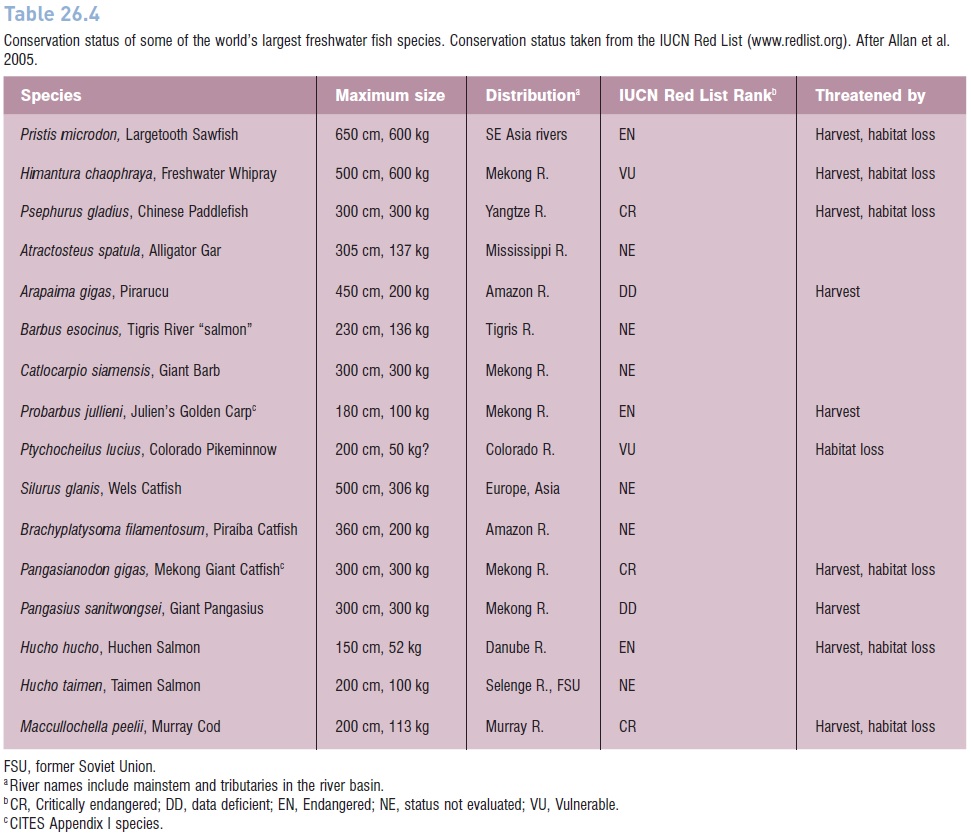
As a result, many species of fresh- and saltwater fishes are in severe decline as a direct result of fishing pressure (e.g., Bluefin Tuna, many sharks and billfishes, Atlantic Cod and other groundfishes, Atlantic Salmon, Orange Roughy, Patagonian Toothfish, Pacific rockfishes, seabasses). The United States National Marine Fisheries Service (NMFS) estimated that 40% of the marine species important to commercial and recreational fisheries in the USA were exploited at unsustainable rates (NMFS 1997, 1999; NRC 1999b) (Fig. 26.10); similar numbers apply globally, especially to larger commercial species (see FAO 2007) (Fig. 26.11). In the 1990s, the actual worldwide annual marine fish catch hovered around 80–85 mmt; the sustainable catch is theoretically somewhere between 69 and 96 mmt (FAO 1995, 2000a; NRC 1999b), again suggesting we are at or beyond what is sustainable. Extrapolations from current population levels and fishing effort indicate that most global stocks of important commercial fishes will be exhausted by the middle of the 21st century (e.g., Worm et al. 2006). Also, many freshwater fisheries worldwide have experienced extreme degradation and decline as a result of a variety of human-induced insults, with the strongest impacts felt again among larger species (Allan et al. 2005) (Table 26.4).
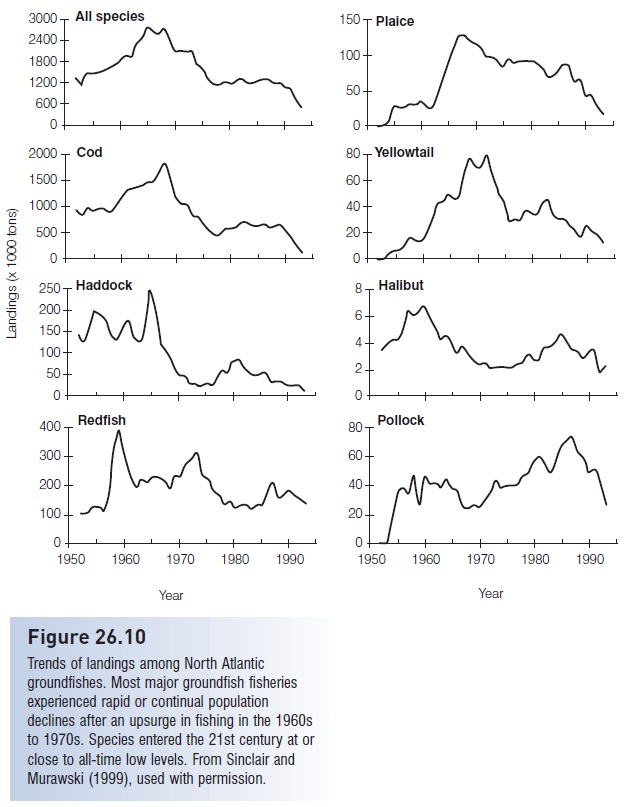
Figure 26.10
Trends of landings among North Atlantic groundfishes. Most major groundfish fisheries experienced rapid or continual population declines after an upsurge in fishing in the 1960s to 1970s. Species entered the 21st century at or close to all-time low levels. From Sinclair and Murawski (1999), used with permission
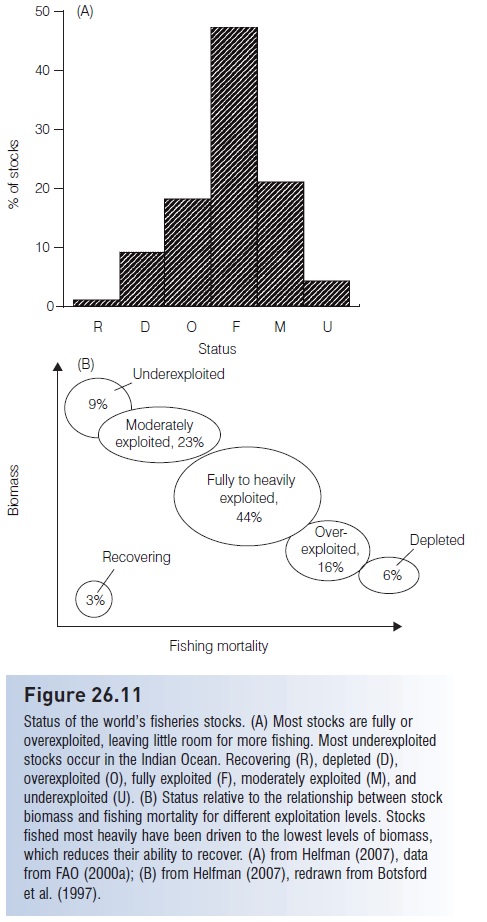
Figure 26.11
Status of the world’s fisheries stocks. (A) Most stocks are fully or overexploited, leaving little room for more fishing. Most underexploited stocks occur in the Indian Ocean. Recovering (R), depleted (D), overexploited (O), fully exploited (F), moderately exploited (M), and underexploited (U). (B) Status relative to the relationship between stock biomass and fishing mortality for different exploitation levels. Stocks fished most heavily have been driven to the lowest levels of biomass, which reduces their ability to recover. (A) from Helfman (2007), data from FAO (2000a); (B) from Helfman (2007), redrawn from Botsford et al. (1997).
Table 26.4
Conservation status of some of the world’s largest freshwater fish species. Conservation status taken from the IUCN Red List (www.redlist.org). After Allan et al. 2005.
Overfishing
In some well-documented examples, overfishing, often in combination with climatic change (Horn & Stephens 2006), has produced dramatic crashes in seemingly inexhaustible stocks. The clupeoid fisheries of California and South America offer an interesting, interwoven example. The history of the California sardine fishery “is a classic case of the rise and fall of a fishery dependent on a pelagic species, of overcapitalization of an industry, and of too many fishing boats using new technologies to harvest a fragile, if not dwindling, resource” .
The Pacific Sardine (Sardinops sagax caeruleus) is a 10– 15 cm long, schooling, epipelagic clupeid that occurs from northern Mexico to the Bering Sea. The fish were typically captured by purse seiners and canned for human consumption. The fishery off California dates to the late 1800s. By 1925, it was the largest fishery in California, with landings of about 175,000 tons. Waste from the canning process was “reduced” into poultry food and fertilizer. The value of reduced sardines soon surpassed that of the canned product and whole fish were then reduced.
Floating reduction plants, anchored outside the 3-mile limit to bypass regulative legislation, became common. Catches climbed steadily to a maximum of 790,000 tons in 1937. For the next 10 years, catches averaged 600,000 tons per year, despite fishery calculations that the stock could only sustain a harvest of 250,000 tons annually. Catches began a steady decline, averaging 230,000 tons from 1946 to 1952, then 55,000 tons from 1953 to 1962, and finally only 24,000 tons from 1963 to 1968. Commercial fishing for Pacific Sardine ended in 1968.
The collapse of the California sardine fishery was in part responsible for the later development, overexploitation, and eventual collapse of similar fisheries in South America and Africa, as well as of king crabs in Alaska.
Boats, gear, and processing equipment were sold at below cost, or costs were subsidized by international agencies. With the infl ux of former sardine boats and personnel, Alaska king crab landings rose from 11.3 tons in 1960 to 81.7 tons in 1980, only to crash to 15.8 tons 2 years later, despite continued activity of the imported boats (Wooster 1990). The exact causes of the decline are debated, but a likely explanation is that overexploited breeding stocks and unfavorable climatic conditions combined to result in poor recruitment of young crabs, demise of the fishery, and lost jobs for most persons associated with the industry.
A similar scenario is offered for the Peruvian fishery for Anchoveta (Engraulis ringens). The fishery became established in the 1950s, when fish were primarily used for human consumption. After 1953, reduction plants were built and boats were added to the fleet, many from the former California sardine fishery. By 1969, Peru caught more tonnage of fish than any other nation, with Anchoveta accounting for up to 98% of the catch. The exploitation of Anchoveta was uncontrolled: in 1970, 12.4 mmt were harvested, about 5 mmt above the calculated maximum sustainable yield. The fishery collapsed soon after, falling below 1 mmt in the mid-1970s. The collapse was again probably caused by a combination of overfished stocks and unfavorable climatic factors, including depressed upwellings associated with the El Niño–Southern Oscillation events of 1972–73 (Caviedes & Fik 1990).
Neither the Pacific Sardine nor the Peruvian Anchovetta have been driven close to extinction, although the term commercial extinction is applied to once-abundant fishes that no longer support significant fisheries.
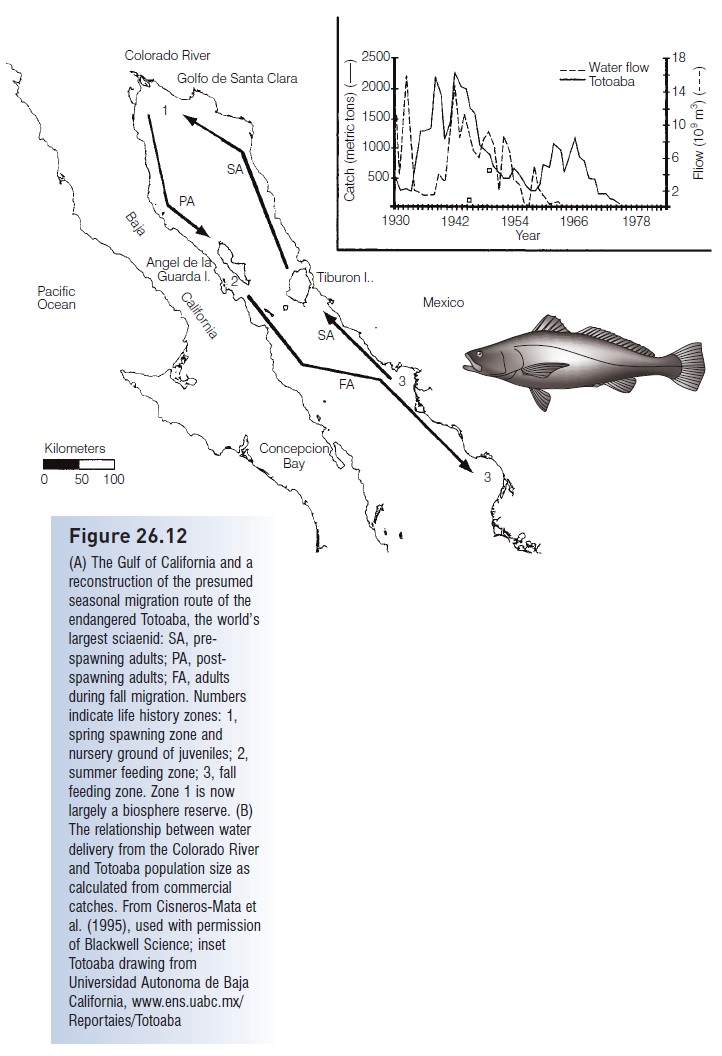
Figure 26.12
(A) The Gulf of California and a reconstruction of the presumed seasonal migration route of the endangered Totoaba, the world’s largest sciaenid: SA, prespawning adults; PA, postspawning adults; FA, adults during fall migration. Numbers indicate life history zones: 1, spring spawning zone and nursery ground of juveniles; 2, summer feeding zone; 3, fall feeding zone. Zone 1 is now largely a biosphere reserve. (B) The relationship between water delivery from the Colorado River and Totoaba population size as calculated from commercial catches. From Cisneros-Mata et al. (1995), used with permission of Blackwell Science;
Uncontrolled exploitation of marine species, particularly those dependent on stressed estuarine systems, can lead to even more serious declines in a species’ abundance. The Giant Totoaba, Totoaba macdonaldi (Sciaenidae) is endemic to the upper Gulf of California and is the largest member of its widespread family, reaching 2 m in length and weighing over 100 kg. Its numbers have been drastically reduced as a result of overfishing on the spawning grounds, dewatering of the Colorado River estuary where it spawns, and bycatch of juveniles by shrimp boats (Fig. 26.12). At one time, it ranked as the most important commercial fish species in the Gulf of California, sought chiefly for its large gas bladder, which was dried and made into soup (the remainder of the body was often discarded). Spawning fish were so abundant that they were speared from small boats. The fishery peaked in 1942 and has declined steadily since (Ono et al. 1983; Cisneros-Mata et al. 1995, 1997). The Totoaba was declared an Endangered US species in 1979, has Critically Endangered status with IUCN, and is one of only nine fish species listed in Appendix I of CITES. The clearest message from these and similar examples, including another very large sciaenid fished off China (Sadovy & Cheung 2003), is that maximizing short-term profits and ignoring biological parameters have long-term, dire ecological and socioeconomic consequences (Glantz & Feingold 1990).
Overfishing creates problems besides reduced opportunities for human exploitation. Genotypic and phenotypic alterations occur commonly among heavily exploited fishes. Overfishing can create bottlenecks in the breeding biology of a species when populations reach critically small numbers, thereby reducing the genetic diversity of the species. For example, the fishery for Orange Roughy (Hoplostethus atlanticus, Trachichthyidae) in New Zealand started up in the early 1980s. Within 6 years, biomass of the stocks was reduced by 70%. Electrophoretic studies indicated significant reductions in genetic diversity of the three monitored stocks (Smith et al. 1991). The danger of reduced genetic diversity is that remaining individuals produce offspring that possess only a limited subset of the original genetic diversity of the species. Genetic adaptation to local conditions does not guarantee tolerance of new or altered environments. Altered conditions are increasingly likely due to human-caused climatic or chemical changes, such as might occur from global warming or ozone depletion. Breeding bottlenecks are one step short of species extinction.
Given enough time, animals can and will adjust their life history characteristics in response to strong predation. Life history theory predicts that individuals in populations exposed to high levels of adult mortality will respond by reproducing at smaller average sizes and ages, will shift from multiple to single reproductive seasons (from iteroparity to semelparity), and will have shorter life spans. Just these kinds of changes have been observed in several exploited species, including Atlantic Cod (Gadus morhua), Haddock (Melanogrammus aeglefinus), other gadids, Gag Grouper (Mycteroperca microlepis), Vermilion Snapper (Rhomboplites aurorubens), Atlantic Mackerel (Scomber scombrus), and Pacific Halibut (Hippoglossus stenolepis) (Upton 1992; O’Brien et al. 1993). Such shifts may reflect adjustments in the phenotype of remaining individuals or selection for genotypically determined differences in life history traits, or both. The alarming fact is that most of our
marine fish stocks are overutilized and that the observed shifts in life history characteristics create fish populations that are less useful to humans. Increasing evidence indicates that fishes undergo actual evolutionary change as a result of overexploitation.
Fishing as an evolutionary force
It is well established that fish populations under exploitation shift their growth rates and ages and sizes of reproduction, growing rapidly and maturing at smaller sizes and younger ages than unexploited populations. The fisheries literature documents many examples of changes in weight at age, length at age, length at maturation, and age at maturation in exploited stocks, with most species showing reduced weights, lengths, and ages, as well as accelerated growth (Law 2000). The response is in part phenotypic. Reductions in abundance cause increased body growth in the remaining individuals (perhaps due to reduced intraspecific competition for food); the ensuing faster growth rates generally result in maturation at smaller sizes and younger ages (see Trippel 1995). The response is also in part statistical because of what we measure. Fisheries tend to target larger individuals in a population. We measure what remains, and what remains are smaller individuals. In either case – phenotypic response or statistical artifact – no evolution is necessary, beyond an evolved response that programs individuals to grow faster and reproduce at smaller sizes when food is more available or numbers of conspecifics are low (the latter condition, a behavioral response dependent on the abundance of conspecifics, is the oftdescribed Allee effect).
However, we are becoming increasingly aware of actual evolutionary impacts of exploitation on fish life histories. Initial support for the idea came from a few field studies or was inferred from laboratory manipulations using small, short generation, nonexploited species (Hutchings 2000b). Geneticists had little doubt that fishing could cause evolution. Allendorf et al. (1987, p. 141) unequivocally stated that “all populations of fish that are included in a sport or commercial fishery will inevitably be genetically changed by harvesting”. But before the early 1980s, the idea that fish populations would experience genetically based changes as a result of fishing was discounted by most fishery biologists (Policansky 1993a; see also Miller 1957); evolution was not incorporated into management models and plans (Policansky 1993b). Plastic phenotypic responses were likely to occur more quickly and be more noticeable than evolved changes (Jennings & Kaiser 1998), and fisheries managers showed “a continuing reluctance . . . to take seriously the threat of genetic change brought about through fishing” (Law & Stokes 2005, p. 241).
However, fishing has considerable potential as an evolutionary force. Fishing is a tremendous source of mortality, and most fisheries target prey nonrandomly and are size and locale selective. Such constant, strong, “directional” selection often leads to rapid, evolved counteradaptations. Many life history traits that influence fisheries yields – such as growth rate, fecundity, and age and size at maturation – are under genetic control with relatively high heritability (Policansky 1993a, 1993b; Law 2000; Palumbi 2001). Also, life history traits display suffi - cient variation to be changed by evolution (Trippel 1995). There has also been suffi cient time for evolution to occur, in terms of number of generations needed for significant genetic change. Across a range of taxa, evolution has been shown in less than 10 generations, sometimes in as few as two or three (e.g., Falconer & Mackay 1996). Field studies of salmonids have shown detectable divergence among populations in eight to 13 generations (Hendry et al. 2000; Haugen & Vollestad 2001; Hendry 2001).
Given this set of criteria that are often used to determine whether traits can be expected to change in response to selection forces, it is not surprising to find many examples of evolved, adaptive change in exploited fishes, including findings from several decades ago. Pacific salmon species have been subjected to commercial and recreational trolling, gill netting, and seining. Population characteristics have changed over time in response to exploitation patterns, including an overall decline in average size in all species studied (Ricker 1981). Over a 60-year period, Chinook Salmon matured on average 2 years earlier and at half the original size. In 1950, when fishers for Coho and Pink Salmon began to be paid according to size rather than number of fish caught, larger mesh gill nets were employed to catch larger fish, accelerating the shift in stocks to smaller, younger fish. Ricker (1981) attributed these shifts to cumulative genetic effects of removing fish of larger than average size.
A clearer example comes from a gill net fishery in Lesser Slave Lake, Alberta, for Lake Whitefish, Coregonus clupeaformis (Handford et al. 1977). Gill nets removed large, heavy, fast-growing fish, leading to declines in growth rate and condition factor and an increase in mean age, but little change in mean length at age. Declining growth rate and increasing mean age contrast with the usual, densitydependent, compensatory (phenotypic) response. Progressive changes in condition factor were particularly informative. Condition factor is higher in fatter fish, but fat fish are more likely than thin fish to be trapped in gill nets. Condition factor declined dramatically with time in all age groups, to the extent that fish of a given age and length in the 1970s often weighed half what similar age or length fish weighed in the 1940s (Figure 26.13).
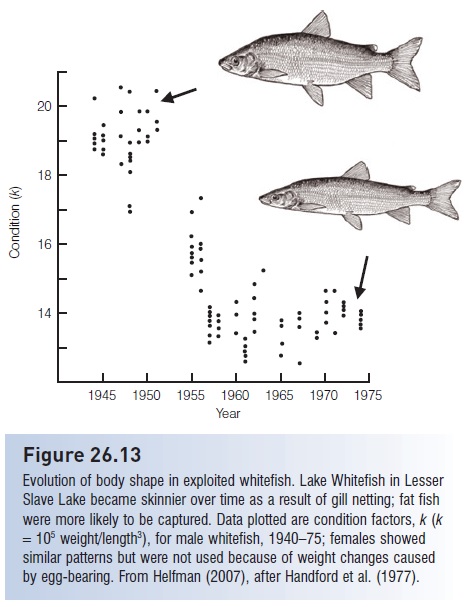
Figure 26.13
Evolution of body shape in exploited whitefish. Lake Whitefish in Lesser Slave Lake became skinnier over time as a result of gill netting; fat fish were more likely to be captured. Data plotted are condition factors, k (k =105 weight/length3), for male whitefish, 1940–75; females showed similar patterns but were not used because of weight changes caused by egg-bearing. From Helfman (2007), after Handford et al. (1977).
Similar results have been shown in gill net fisheries for Grayling, Thymallus thymallus, and Sockeye Salmon (Hamon et al. 2000; Haugen & Vollestad 2001).
Most convincing are laboratory tests imposing the kind of selection experienced by exploited fishes. Conover and Munch (2002) simulated size-selective fishing by rearing fast- and slow-growing Atlantic Silversides, Menidia menidia. After only four generations of directional selection for growth rate, groups from which fish with the fastest growth rates were removed (large-harvested fish) and groups from which slow-growing individuals were removed (small-harvested fish) reversed their growth rate characteristics. The previous fast growers (large-harvested fish) had mean weights nearly half those of the small-harvested lineage that previously possessed slow growth characteristics. The growth differences had a demonstrated genetic basis. Egg size and biomass yield also differed, indicating that continued harvest of the largest members of a stock reduced biomass and egg production. “Selection on adult size caused the evolution of a suite of traits likely to influence population growth rate and productivity” (Conover & Munch 2002, p. 95). The traits evolved are largely the opposite of what the fishing industry and society would prefer.
At least 40 generations of North Atlantic cod, herring, plaice, and sole have experienced intensive fishing, sufficient to alter genetic make-up (Policansky 1993a). Anything that causes mortality is a strong selection force, and fishing mortality often exceeds natural mortality by a factor of two or three in many if not most heavily exploited species (e. g., Stokes et al. 1993; Stokes & Law 2000). Annual, nonfishing, mortality rates in many post-larval and post-recruitment finfish species run at less than 10%, whereas mortality rates targeted to achieve maximum sustainable yields are around 50%, and actual fishing mortality is often between 70% and 90%. In the case of depleted Atlantic Cod, clear evidence of progressive, fisheries-induced evolution of maturation patterns existed and could have foretold imminent collapse (Olsen et al. 2004). Given the history and intensity of most commercial fisheries, fishing can be considered a long experiment with “more than enough time for selection to produce substantial genetic changes on almost every quantitative character that has been examined” Policansky 1993a, p. 6).
Palumbi (2001) argued that humans have become the world’s greatest evolutionary force, having exerted strong natural selection in such areas as disease-resistant viruses and bacteria, pesticide-resistant insects and plants, artifi cial selection via domestication (hatchery salmon), and altered characteristics in introduced species, many of which are detrimental to human welfare. To this list should be added the evolutionary impacts that intensive exploitation has had on the many fish species that provide essential goods and services to humanity.
A nonsolution: free enterprise
Reliance on market factors to protect declining stocks has proven illusory. A decrease in catch despite increased effort does not necessarily discourage exploitation, especially for so-called market force-free species, i.e., fish that are too valuable to not catch. For example, western Atlantic stocks of Bluefin Tuna decreased by 90% between 1972 and 1992, from 225,000 fish to 22,000 fish, and yet intensive fishing continued. In 2001, a 201 kg Bluefin Tuna caught off northern Japan was sold at the Tsukiji Central Fish Market in Tokyo for a record $173,600 ($863/kg or $391/lb) (AP 2001). This sort of profitability threatens other large and valuable fish species such as sturgeons, coelacanths, Swordfish, Whale Sharks, and some tropical reef species desirable for aquaria and the live fish restaurant trade (Sadovy & Vincent 2002; Helfman 2007).
Bycatch
A topic of increasing relevance to the conservation of marine fishes concerns bycatch in trawl and longline fisheries (Murray et al. 1992; Perra 1992; Safina 2001a, 2002).Few fisheries employ gear that can catch one species to the exclusion of all others. For example, dolphins, whales, turtles, and pinnipeds are frequently captured in gill nets or in purse seine nets set for tunas and billfishes, and seabirds and turtles are caught in longline sets. Because bycatch often goes unreported, it is difficult to accurately estimate its extent. Different assessments come to different conclusions, but available data indicate that discarded biomass amounts to 25–30% of nominal catch, or about 30 mmt (Alverson et al. 1994; FAO 1995; Alverson 1997). By some estimates, bycatch has contributed to declines among 42– 48% of marine and diadromous species that are considered imperiled by the USA and IUCN (Kappel 2005).
The bycatch problem is particularly acute when trawl nets with small mesh sizes are dragged along the bottom of the ocean in pursuit of groundfish or shrimp. Frequently, the incidental or bycatch (or by-kill) of fishes exceeds the catch of the targeted species. Although varying on a seasonal and regional basis, average fish : shrimp weight ratios of 1 : 1 to 3 : 1 have been reported for southeastern US shrimp fisheries. These numbers can run as high as 130 : 1 (=130 kg of “scrap” fish for each kilogram of shrimp). Overall, 105 species of finfishes are captured by shrimp trawlers in the southeastern USA. On a species basis, 5 billion Atlantic Croaker (Micropogonias undulatus, Sciaenidae), 19 million Red Snapper (Lutjanus campechanus, Lutjanidae), and 3 million Spanish Mackerel (Scomberomorus maculatus, Scombridae) were among nearly 10 billion individuals and 180 million kg of incidental fishes killed by shrimp trawlers in the Gulf of Mexico in 1989 (Nichols
et al. 1990).
Because of the small mesh size of the shrimp trawl nets, most of the fishes captured are (i) juveniles, (ii) smaller than legal size limits, or (iii) undesirable small species. Even larger mesh sizes do not prevent bycatch because once the net begins to fill with fish or shrimp, small individuals caught subsequently are trapped without ever encountering the mesh. In any case, these incidental captures are unmarketable and are usually shoveled back over the side of the vessel dead or dying.
The bycatch problem is complicated economically, ecologically, and sociologically. Bycatch is a liability to shrimp fishers, clogging the nets and increasing fuel costs because of increased drag on the vessel. Sorting the catch requires time, leading to spoilage of harvested shrimp and reduced time for fishing. Ecologically, high mortality rates among juvenile fishes could contribute to population declines of recreational and commercial species. Evidence to this effect exists for Gulf of Mexico Red Snapper and Atlantic Coast Weakfish (Cynoscion regalis, Sciaenidae). Because the nearshore areas where shrimp concentrate are also important nursery grounds for many fish species, shrimp trawling could have a profound impact on stock size (e.g., Miller et al. 1990).
Alternatively, bycatch is returned to the ecosystem and consumed by predators, detritivores, and decomposers, which could have a positive effect on sportfish, seabird, crab, and even shrimp populations. Available evidence indicates that 40–60% of the 30 mmt of catch discarded annually by commercial fishing vessels, and even more ofnoncatch waste (organisms killed but never brought to the surface), does not lie unused on the bottom of the sea. It becomes available to midwater and benthic scavengers, transferring material into the benthic food web and making energy available to foragers that is normally tied up in benthic, suprabenthic, midwater, and pelagic species (Britton & Morton 1994; Groenewold & Fonds 2000).
Overfishing and overdiscarding may thus contribute to a syndrome known as fishing down of food webs (Fig. 26.14), whereby we eliminate apex predators and large species while transforming the ocean into a simplified system increasingly dominated by microbes, jellyfish, benthic invertebrates, plankton, and planktivores (e.g., Pauly et al. 1998; Jackson et al. 2001). The strongest evidence for the fishing down phenomenon exists in global catch statistics that show alarming shifts in species composition from high value demersal species to lower value pelagic species: “the world fish supply is increasingly relying on variable, small pelagic and other-low value species, thereby concealing the slow but steady degradation of the demersal, high-value resources” (Garcia & Newton 1997, p. 23). In the last three decades of the 20th century, the global fishing fleet doubled in size and technology advanced immeasurably. Despite increased effort and technology, total catch stabilized, but landing rates of the most valuable species fell by 25%.
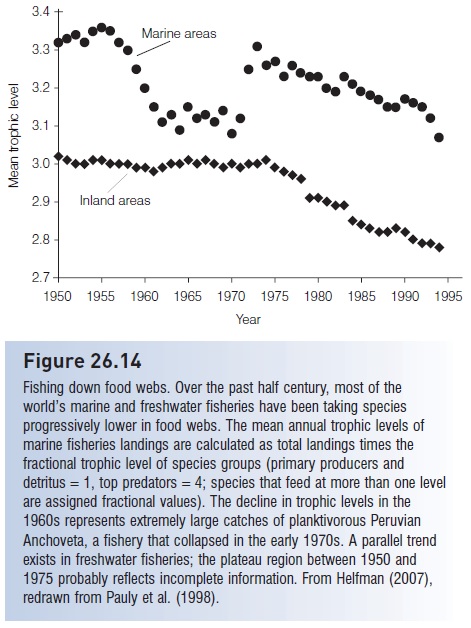
Figure 26.14
Fishing down food webs. Over the past half century, most of the world’s marine and freshwater fisheries have been taking species progressively lower in food webs. The mean annual trophic levels of marine fisheries landings are calculated as total landings times the fractional trophic level of species groups (primary producers and detritus =1, top predators =4; species that feed at more than one level are assigned fractional values). The decline in trophic levels in the 1960s represents extremely large catches of planktivorous Peruvian Anchoveta, a fishery that collapsed in the early 1970s. A parallel trend exists in freshwater fisheries; the plateau region between 1950 and 1975 probably reflects incomplete information. From Helfman (2007), redrawn from Pauly et al. (1998).
Conservation organizations have decried the obvious and wanton waste associated with bycatch. Public concern over high mortality rates of endangered marine turtles captured in shrimp trawls led to the development of turtle exclusion devices (TEDs) in the 1980s. TEDs were incorporated into the shrimp net design with the purpose of directing turtles out of nets without unacceptably reducing shrimp catches (Broadhurst 2000). Marine engineers and fishers also developed shrimp net designs that incorporate bycatch reduction devices (BRDs), taking advantage of behavioral differences between shrimp and fish or between different fishes to separate species (Engas et al. 1998). Other suggested solutions include prohibiting shrimping during seasons when bycatch is relatively high or where vulnerable life history stages of nontargeted species are concentrated.
Aquarium fishes
Data on numbers of fishes involved [in the aquarium trade] are scattered, incomplete, often contradictory, seldom documented, plagued by misidentifications, and generally out-of-date.
Helfman (2007, p. 375)
The export value of all marine and freshwater fishes and invertebrates used in the aquarium trade in the late 1990swas estimated at around US$200 million (FAO 1999, 2000b). Import values were roughly twice that number, and the retail values doubled the price again (Wood 2001), making the global retail trade worth roughly $800 million. That number undoubtedly underestimates the real value, given other calculations. Total expenditures for aquarium keeping include the value of tanks, pumps, filtration, lighting, chemicals, plants, foods, transportation, and packaging. A 1970s estimate put the total retail value at $4 billion (Pyle 1993), which climbed to $15 or even $30 billion by the mid-1990s (Tomey 1996; Bartley 2000). Freshwater fishes dominate the trade, accounting for 80–90% of the estimated 350 million fishes traded annually (Andrews
Annual imports of marine tropical fishes involved 10–40 million fish (Wood 2001), or about 10% of the total trade (90% freshwater species, 9% marine, and 1% estuarine; 98% tropical and 2% cold water; Young 1997). Although 60% of income from the sale of fishes goes to developing, tropical countries, non-fish components are produced more widely and much of these profits goes to developed nations.
Geographic origins and ecological impacts also differ greatly between marine and fresh water. Twenty percent of the freshwater fishes are wild caught, with most fishes cultured in ponds, often far from their native habitats (Chapman et al. 1997). Centers of production of farmraised freshwater species in the Far East are Thailand, Singapore, Indonesia, Hong Kong, and Malaysia; in the US, Florida in particular, and Texas, California, and Hawaii rear and distribute species native to a variety of countries. Freshwater ornamental species are biogeographically tied to Southeast Asia, South America, and Africa, although wild-caught species most recently are taken from the Amazon and the major river systems of Southeast Asia (Watson & Shireman 1996).
In contrast, 99% of the marine fishes come directly from the sea. Only a small number, no more than 25 or 30 species of the more than 1000 species traded, are captivereared with commercial success (Moe 1999; Tlusty 2002). Commonly cultured species include anemonefishes (Amphiprion and Premnas), gobies (Gobiosoma,Gobiodon, Amblygobius), pseudochromid dottybacks (Pseudochromis), jawfish (Opisthognathus), basslets (Gramma), and Banggai Cardinalfish (Pterapogon quaderni). Marine collecting is particularly destructive because of the widespread use of poisons, such as sodium cyanide, rotenone, bleach, and quinaldine, to “anesthetize” the fishes prior to capture. In the 1980s, 80–90% of fish caught in the Philippines may have been collected using cyanide (Rubec 1986, 1988); similar numbers likely characterized other countries (Barber & Pratt 1997; Sadovy & Vincent 2002). These toxins kill targeted fishes as well as other reef organisms. On the positive side, efforts at reducing cyanide use via training collectors in nondestructive methods have shown results. Fish with detectable cyanide residues in the Philippines fell from over 80% in 1993 to 47% in 1996, and 20% in 1998 (Rubec et al. 2000).
Destruction of fishes by the aquarium trade is a sordid and underpublicized fact. Mortality rates of wild-captured fishes, ignoring fishes that die during or incidental to capture, are difficult to establish and vary by locale and collecting method (one estimate is that only 10% of the fishes affected by cyanide were actually targeted; Rubec 1988). Mortality rates of 80% for cyanide-captured fishes are not unusual. For noncyanide-caught reef fishes, estimates from a variety of locales indicate 10–40% mortality during holding prior to export, 5–10% during initial transport, and 5–60% during holding after import. Summed mortalities therefore range between 20% and 80% after capture and before retail sales (Wood 1985; Sadovy 1992; Pyle 1993; Vallejo 1997; Rubec et al. 2000). For wildcaught South American and African freshwater fishes, preexport mortality has been placed at 50–70%, with as much as 80% additional loss for cardinal and neon tetras shipped from South America to the USA (Waichman et al. 2001). African cichlids are treated more kindly and have lower mortalities, perhaps less than 5% (www.lakemalawi.com).
Data on aquarium longevity are largely anecdotal and subject to unknown biases, but are far from encouraging.
Wood (1985), surveying UK hobbyists, reported that 50% of marine fish died within 6 months of purchase, and nearly 70% died within a year. In home aquaria, cyanide-caught fishes may die when fed due to irreversible, progressive liver damage caused by the cyanide. Such delayed mortality may occur several weeks after capture and sale. Many tropical marine species are ill-suited for aquaria because of environmental intolerance or specialized feeding habits. They are “impossible or difficult to keep, even when maintained under ideal conditions by experienced aquarists” (Wood 2001, p. 31). Sadovy and Vincent (2002) estimated that perhaps 40% of frequently traded ornamental marine species were unsuitable for the average aquarist. Hard to keep species include those dependent on live coral and other live organisms for food, such as some butterfl yfishes and angelfishes. These are often colorful species and hence desirable, but their capture and sale are unjustifiable.
A number of other ecological and sociological issues plague the aquarium trade (see Helfman 2007 for details).
These includes the unsustainable harvesting of live coral and “live rock”; coral death from cyanide and other destructive collecting methods; compromised health of collectors due to cyanide toxicity and unsafe diving practices; destruction of food fishes important to local economies; alien introductions due to escapes from holding facilities and release of unwanted pets, which also transmit pathogens (see Fuller et al. 1999; Whitfield et al. 2002; Semmens etal. 2004); and population depletions and biodiversity loss. The latter problem was suspected but only recently confi rmed with good data. Tissot and Hallacher (2003) compared population sizes of popular aquarium fishes at locales on the island of Hawaii where collecting occurred or was restricted. They found that seven of the 10 targeted, relatively common species were significantly depleted at collection
Declines among aquarium species ranged from 38% to 75%. In all likelihood, moderate levels of collecting have minimal impact, especially for abundant species. But the available data shift the burden of proof onto those who maintain that collecting has minimal impact. We now know otherwise.
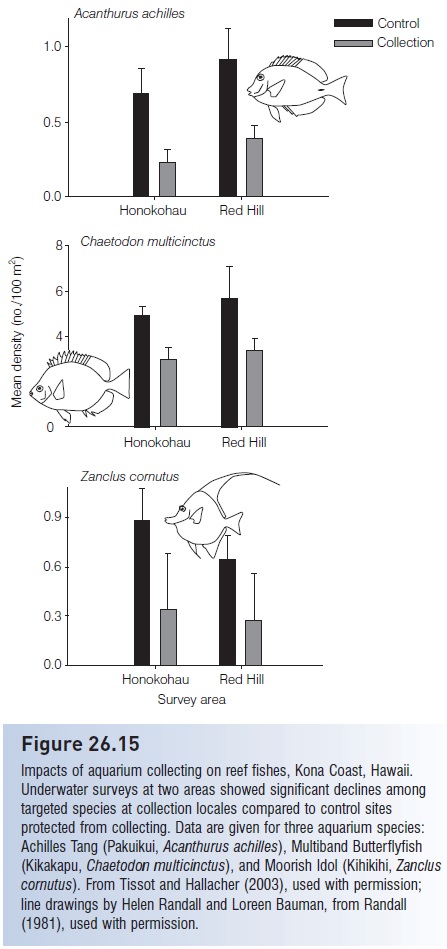
Figure 26.15
Impacts of aquarium collecting on reef fishes, Kona Coast, Hawaii. Underwater surveys at two areas showed significant declines among targeted species at collection locales compared to control sites protected from collecting. Data are given for three aquarium species: Achilles Tang (Pakuikui, Acanthurus achilles), Multiband Butterfl yfish(Kikakapu, Chaetodon multicinctus), and Moorish Idol (Kihikihi, Zanclus cornutus). From Tissot and Hallacher (2003), used with permission; line drawings by Helen Randall and Loreen Bauman, from Randall (1981), used with permission.
Public aquaria promote important conservation and public education goals. Home aquaria are of unquestionable educational and aesthetic value. Most ichthyologists have at least one in their own home. However, these values do not justify the ecological problems created by an unregulated industry, including the detrimental effects of introduced species and diseases on native fishes, invertebrates, and plants, and the defaunation of tropical reefs and rivers. Keeping reef fishes in aquaria cannot be rationalized on the grounds of species preservation. Few reef species have been successfully bred and raised in captivity, largely because of their complex life histories and age-specific habitat and feeding requirements (see Larval feeding and survival). Nondestructive capture methods, bag limits, restricted areas and seasons, and most importantly, licensed captive breeding, can provide a diversity of interesting fishes to meet the home aquarist’s needs while protecting natural environments. A number of agencies and organizations have emerged in recent years to improve conditions in all steps of thesupply chain, to lessen ecological impacts, and to better the lives of the people involved in the trade, especially the collectors.
The American Marinelife Dealers’ Association has produced an “Ecolist” that classifi es aquarium fishes according to their likelihood of surviving in captivity (www.amdareef.com). Project Seahorse (http://seahorse.fisheries.ubc.ca) has specifically addressed socioeconomic and ecological issues associated with the seahorse trade. The Marine Aquarium Council (www.aquariumcouncil.org) has mounted a campaign to develop an ecologically responsible chain of supply, including certifi cation of fishes caught and kept in a sustainable, responsible manner. Project Piaba, a community-based organization centered in Amazonas, pro- motes a sustainable fishery and emphasizes diversifi cation of the fishery, rotation among collecting areas, and ecosystem protection, with a goal of developing a “green certifi cation” process that would identify sustainably caught fish (Chao et al. 2001; Chao & Prang 2002; see http://opefe.com/piaba.html). Project Piaba points out that by providing stable incomes, collecting in Amazonia diverts people from more dangerous, ecologically destructive, extractive activities such as gold mining (which causes sedimentation and mercury pollution problems), cattle raising (requiring largescale deforestation), uncontrolled lumbering, and exploitation of endangered manatees and turtles (Prang 1996; Norris & Chao 2002). Ornamental fishes are “a sustainable by-product of an intact forest . . . Buy a fish and save a tree” (Norris & Chao 2002).
Related Topics