Chemistry - Thermodynamic principle of metallurgy | 12th Chemistry : UNIT 1 : Metallurgy
Chapter: 12th Chemistry : UNIT 1 : Metallurgy
Thermodynamic principle of metallurgy
Thermodynamic
principle of metallurgy
As we discussed, the
extraction of metals from their oxides can be carried out by using different
reducing agents. For example, consider the reduction of a metal oxide MxOy.
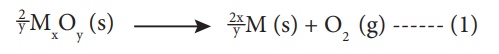
The above reduction may
be carried out with carbon. In this case, the reducing agent carbon may be
oxidised to either CO or CO2.
C + O2 → CO2 (g) ------(2)
2C + O2 → 2CO (g) ------(3)
If carbon monoxide is
used as a reducing agent, it is oxidised to CO2 as follows,
2CO + O2 → 2CO2
(g) ------ (4)
A suitable reducing
agent is selected based on the thermodynamic considerations. We know that for a
spontaneous reaction, the change in free energy (ΔG) should be negative.
Therefore, thermodynamically, the reduction of metal oxide [equation (1)] with
a given reducing agent [Equation (2), (3) or (4)] can occur if the free energy
change for the coupled reaction. [Equations (1) & (2), (1) & (3) or (1)
& (4)] is negative. Hence, the reducing agent is selected in such a way
that it provides a large negative ΔG value for the coupled reaction.
1. Ellingham diagram
The change in Gibbs free
energy (ΔG) for a reaction is given by the expression.
ΔG = ΔH - TΔS ------ (1)
where, ΔH is the
enthalpy change , T the temperature in kelvin and ΔS the entropy change. For an
equilibrium process, ΔG⁰
can be calculated using the equilibrium constant by the following expression
ΔG⁰ =-RT lnKp
Harold Ellingham used
the above relationship to calculate the ΔG⁰
values at various temperatures for the reduction of metal oxides by treating
the reduction as an equilibrium process.
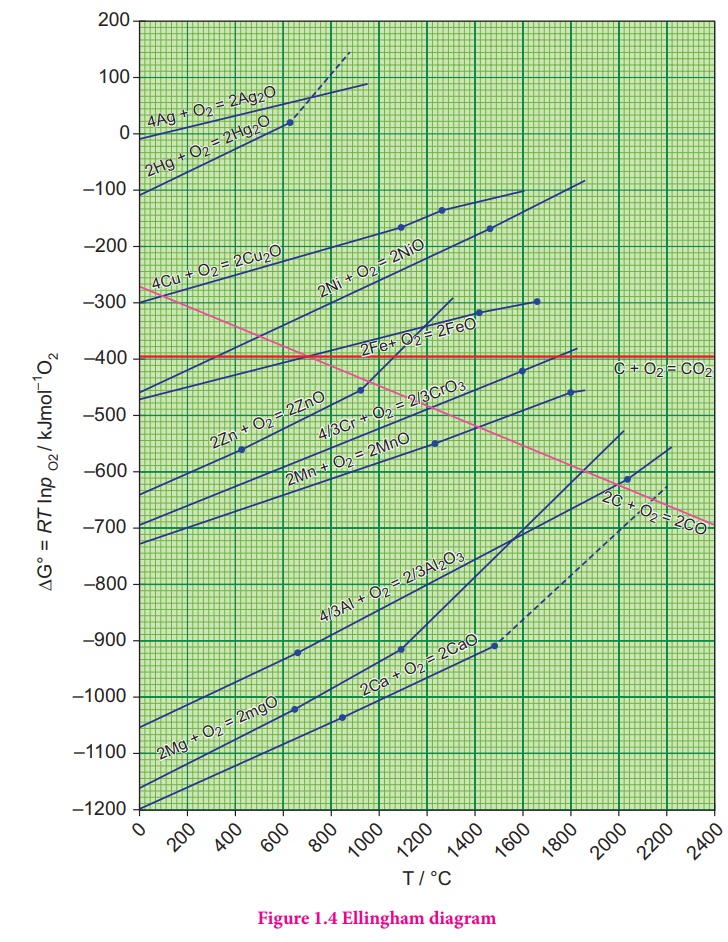
He has drawn a plot by
considering the temperature in the x-axis and the standard free energy change
for the formation of metal oxide in y-axis. The resultant plot is a straight
line with ΔS as slope and ΔH as y-intercept. The graphical representation of
variation of the standard Gibbs free energy of reaction for the formation of
various metal oxides with temperature is called Ellingham diagram
Observations from the Ellingham diagram.
1. For most of the metal
oxide formation, the slope is positive. It can be explained as follows. Oxygen
gas is consumed during the formation of metal oxides which results in the
decrease in randomness. Hence, ΔS becomes negative and it makes the term, TΔS
positive in the straight line equation.
2.
The graph for the formation of carbon monoxide is a
straight line with negative slope. In this case ΔS is positive as 2 moles of CO
gas is formed by the consumption of one mole of oxygen gas. It indicates that
CO is more stable at higher temperature.
3.
As the temperature increases, generally ΔG value for
the formation of the metal oxide become less negative and becomes zero at a
particular temperature. Below this temperature, ΔG is negative and the oxide is
stable and above this temperature ΔG is positive. This general trend suggests
that metal oxides become less stable at higher temperature and their
decomposition becomes easier.
4. There
is a sudden change in the slope at a particular temperature for some metal
oxides like MgO, HgO. This is due to the phase transition (melting or
evaporation).
2. Applications of the Ellingham diagram:
Ellingham diagram helps
us to select a suitable reducing agent and appropriate temperature range for
reduction. The reduction of a metal oxide to its metal can be considered as a
competition between the element used for reduction and the metal to combine
with oxygen. If the metal oxide is more stable, then oxygen remains with the
metal and if the oxide of element used for reduction is more stable, then the oxygen
from the metal oxide combines with elements used for the reduction. From the
Ellingham diagram, we can infer the relative stability of different metal
oxides at a given temperature.
1. Ellingham diagram for the formation of Ag2O and HgO
is at upper part of the diagram and their decomposition temperatures are 600
and 700 K respectively. It indicates that these oxides are unstable at moderate
temperatures and will decompose on heating even in the absence of a reducing
agent.
2. Ellingham diagram is used to predict thermodynamic feasibility
of reduction of oxides of one metal by another metal. Any metal can reduce the
oxides of other metals that are located above it in the diagram. For example,
in the Ellignham diagram, for the formation of chromium oxide lies above that
of the aluminium, meaning that Al2O3 is more stable than
Cr2O3. Hence aluminium can be used as a reducing agent
for the reduction of chromic oxide. However, it cannot be used to reduce the
oxides of magnesium and calcium which occupy lower position than aluminium
oxide.
3.
The carbon line cuts across the lines of many metal oxides and
hence it can reduce all those metal oxides at sufficiently high temperature.
Let us analyse the thermodynamically favourable conditions for the reduction of
iron oxide by carbon. Ellingham diagram for the formation of FeO and CO
intersects around 1000 K. Below this temperature the carbon line lies above the
iron line which indicates that FeO is more stable than CO and hence at this
temperature range, the reduction is not thermodynamically feasible. However,
above 1000 K carbon line lies below the iron line and hence, we can use coke as
reducing agent above this temperature. The following free energy calculation
also confirm that the reduction is thermodynamically favoured.
From the Ellingham
Diagram at 1500 K,
2Fe (s) + O2(g) → 2FeO (g) ΔG1 = -350 kJ mol–1 ------ (5)
2C (s) + O2(g) → 2CO (g) G2 = -480 kJ
mol–1------ (6)
Reverse the reaction (1)
2FeO (s) → 2Fe (s)+ O2
(g) – ΔG1 = +350 kJ mol–1
------ (5)
Now couple the reactions
(2) and (3)
2FeO (s) + 2C → 2Fe
(l,s)+ 2CO (g) ΔG3 =
-130 kJ mol–1 ------ (8)
The standard free energy
change for the reduction of one mole of FeO is, ΔG3/2 = -65 kJ mol-1
Limitations of Ellingham diagram
1. Ellingham diagram is
constructed based only on thermodynamic considerations. It gives information
about the thermodynamic feasibility of a reaction. It does not tell anything
about the rate of the reaction. More over, it does not give any idea about the
possibility of other reactions that might be taking place.
2. The interpretation of
ΔG is based on the assumption that the reactants are in equilibrium with the
products which is not always true.
Related Topics