Chapter: Software Testing : Controlling and Monitoring
Status meetings -Reports and control issues
Status meetings -Reports and
control issues
Roughly
forty measurements have been listed here that are useful for monitoring testing
efforts. Organizations should decide which are of the most value in terms of
their current TMM level, and the monitoring and controlling goals they want to
achieve. The measurement selection process should begin with these goals, and
compilation of a set of questions most likely to be asked by management
relating to monitoring and controlling of the test process. The measurements
that are selected should help to answer the questions (see brief discussion of
the Goal/Question/Metric paradigm in Section 9.1). A sample set of questions is
provided at the beginning of this chapter. Measurement-related data, and other
useful test-related information such as test documents and problem reports,
should be collected and organized by the testing staff. The test manager can
then use these items for presentation and discussion at the periodic meetings
used for project monitoring and controlling. These are called project status
meetings. Test-specific status meetings can also serve to monitor testing
efforts, to report test progress, and to identify any test-related problems.
Testers can meet separately and use test measurement data and related documents
to specifically discuss test status. Following this meeting they can then
participate in the overall project status meeting, or they can attend the
project meetings as an integral part of the project team and present and
discuss test-oriented status data at that time. Each organization should decide
how to organize and partition the meetings. Some deciding factors may be the
size of the test and development teams, the nature of the project, and the
scope of the testing effort. Another type of project-monitoring meeting is the
milestone meeting that occurs when a milestone has been met. A milestone
meeting is an important event; it is a mechanism for the project team to
communicate with upper management and in some cases user/client groups. Major
testing milestones should also precipitate such meetings to discuss
accomplishments and problems that have occurred in meeting each test milestone,
and to review activities for the next milestone phase. Testing staff, project
managers, SQA staff, and upper managers should attend. In some cases process
improvement group and client attendance is also useful.
Milestone
meetings have a definite order of occurrence; they are held when each milestone
is completed. How often the regular statues meetings are held depends on the
type of project and the urgency to discuss issues. Rakos recommends a weekly
schedule as best for small- to medium-sized projects . Typical test milestone
meeting attendees are shown in Figure 9.4. It is important that all test-
related information be available at the meeting, for example, measurement data,
test designs, test logs, test incident reports, and the test plan itself.
Status
meetings usually result in some type of status report published by the project
manager that is distributed to upper management. Testmanagers should produce
similar reports to inform management of test progress. Rakos recommends that
the reports be brief and contain the following items :
• Activities and accomplishments during the reporting
period. All tasks that were attended to should
be listed, as well as which are complete. The latter can be credited with
earned value amounts. Progress made since the last reporting period should also
be described.
Problems encountered since the last meeting period.
The
report should include a discussion of the
types of new problems that have occurred, their probable causes, and how
they impact on the project.Problem solutions should be described.
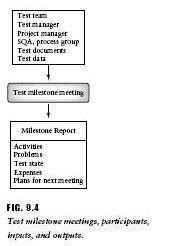
• Problems solved. At previous reporting periods
problems were reported that have now been
solved. Those should be listed, as well as the solutions and the impact on
the project.
• Outstanding problems. These
have been reported previously, but have not been solved to date. Report on any progress.
• Current project (testing) state versus plan. This is
where graphs using process measurement data
play an important role. Examples will be described below. These plots show
the current state of the project (testing) and trends over time.
• Expenses versus budget. Plots and
graphs are used to show budgeted versus actual expenses. Earned value charts and plots are especially useful here.
• Plans for the next time period. List all
the activities planned for the next time period as well as the milestones.
Preparing
and examining graphs and plots using the measurement data we have discussed
helps managers to see trends over time as the test effort progresses. They can
be prepared for presentation at meetings and included in the status report. An
example bar graph for monitoring purposes is shown in Figure 9.1. The bar graph
shows the numbers for tests that were planned, available, executed, and passed
during the first 6 weeks of the testing effort. Note the trends. The number of
tests executed and the number passed has gone up over the 6 weeks, The number
passed is approaching the number executed. The graph indicates to the manager
that the number of executed tests is approaching the number of tests available,
and that the number of tests passed is also approaching the number available,
but not quite as quickly. All are approaching the number planned. If one
extrapolates, the numbers should eventually converge at some point in time. The
bar graph, or a plot, allows the manager to identify the time frame in which
this will occur. Managers can also compare the number of test cases executed
each week with the amount that were planned for execution.
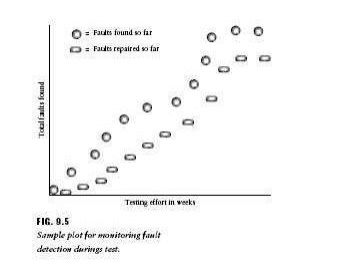
Figure
9.5 shows another graph based on defect data. The total number of faults found
is plotted against weeks of testing effort. In this plot the number tapers off
after several weeks of testing. The number of defects repaired is also plotted.
It lags behind defect detection since the code must be returned to the
developers who locate the defects and repair the code. In many cases this be a
very time-consuming process. Managers can also include on a plot such as Figure
9.5 the expected rate of defect detection using data from similar past
projects. However, even if the past data are typical there is no guarantee that
the current software will behave in a similar way. Other ways of estimating the
number of potential defects use rules of thumb (heuristics) such as ―0.5-1% of
the total lines of code‖ [8].
These are at best guesses, and give managers a way to estimate the number of
defects remaining in the code, and as a consequence how long the testing effort
needs to continue. However, this heuristic gives no indication of the severity
level of the defects. Hetzel gives additional examples of the types of plots
that are useful for monitoring testing efforts [9]. These include plots of
number of requirements tested versus weeks of effort and the number of
statements not yet exercised over time. Other graphs especially useful for
monitoring testing costs are those that plot staff hours versus time, both
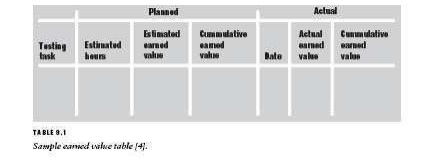
actual and planned. Earned value tables and graphs are also useful. Table 9.1
is an example.
Note that
the earned value table shown in Table 9.1 has two parti tions, one for planned
values and one for actual values. Each testing task should be listed, as well
as its estimated hours for completion. The total hours for all the tasks is
determined and the estimated earned value for each task is then calculated
based on its estimated percentage of the total time as described previously.
This gives a relative value to each testing task with respect to the entire
testing effort. The estimated earned values are accumulated in the next column.
When the testing effort is in progress, the date and actual earned value for
each task is listed, as well as the actual accumulated earned values. In status
report graphs, earned value is usually plotted against time, and on the same
graph budgeted expenses and actual expenses may also be plotted against time
for comparison. Although actual expenses may be more than budget, if earned
value is higher than expected, then progress may be considered satisfactory
[4,5]. The agenda for a status meeting on testing includes a discussion of the
work in progress since the last meeting period. Measurement data is presented,
graphs are produced, and progress is evaluated. Test logs and incident reports
may be examined to get a handle on the problems occurring.
If there
are problem areas that need
attention, they are discussed
and
solutions are suggested to get the testing effort back on track (control it).
Problems currently occurring may be closely associated with risks identified by
the test manager through the risk analysis done in test planning. Recall that
part of the planner‘s job is identify and prioritize risks, and to develop
contingency plans to handle the risk-prone events if they occur. If the test
manager has done a careful job, these contingency plans may be applied to the
problem at hand. Suggested and agreed-upon solutions should appear in the
status report. The corrective actions should be put in place, their effect on testing
monitored, and their success/failure discussed at the next status meeting. As
testing progresses, status meeting attendees have to make decisions about
whether to stop testing or to continue on with the testing efforts, perhaps
developing additional tests as part of the continuation process. They need to
evaluate the status of the current testing efforts as compared to the expected
state specified in the test plan. In order to make a decision about whether
testing is complete the test team should refer to the stoptest criteria
included in the test plan (see the next section for a discussion on stop-test
criteria). If they decide that the stop-test criteria have been met, then the
final status report for testing, the test summary report, should be prepared.
This is a summary of the testing efforts, and becomes a part of the project‘s
historical database. At project postmortems the test summary report can be used
to discuss successes and failures that occurred during testing. It is a good
source for test lessons learned for each project.
Related Topics