Maths - Solved Example Problems for Regression Analysis | 11th Business Mathematics and Statistics(EMS) : Chapter 9 : Correlation and Regression analysis
Chapter: 11th Business Mathematics and Statistics(EMS) : Chapter 9 : Correlation and Regression analysis
Solved Example Problems for Regression Analysis
Example 9.9
Calculate the regression coefficient and obtain the lines of regression for the following data
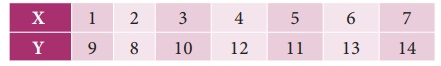
Solution:

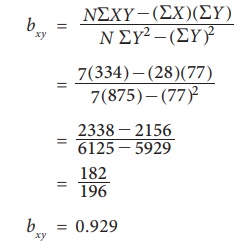
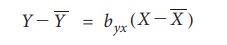
Regression coefficient of X on Y
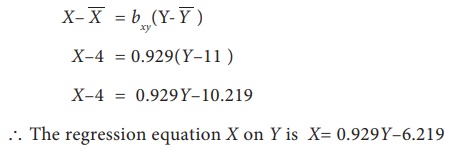
(i) Regression equation of X on Y
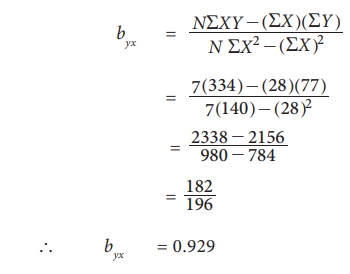
(ii) Regression coefficient of Y on X
(iii) Regression equation of Y on X
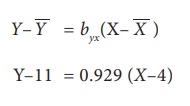
Y = 0.929XŌĆō3.716+11
= 0.929X+7.284
The regression equation of Y on X is Y= 0.929X + 7.284
Example 9.10
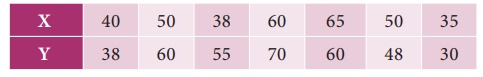
Calculate the two regression equations of X on Y and Y on X from the data given below, taking deviations from a actual means of X and Y.
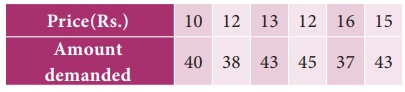
Estimate the likely demand when the price is Rs.20.
Solution:
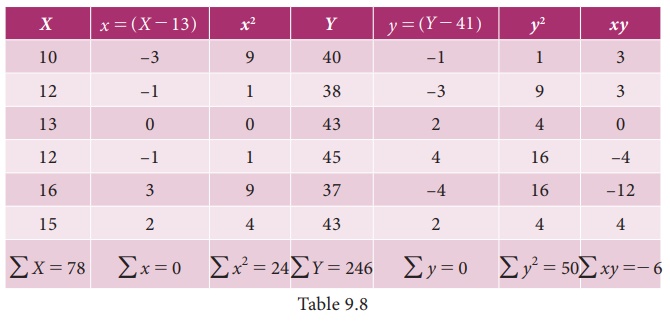
Calculation of Regression equation
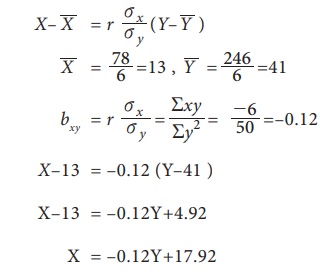
(i) Regression equation of X on Y
(ii) Regression Equation of Y on X
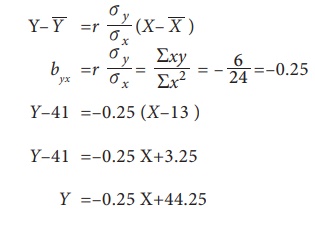
When X is 20, Y will be
= ŌĆō0.25 (20)+44.25
= ŌĆō5+44.25
= 39.25 (when the price is Rs. 20, the likely demand is 39.25)
Example 9.11
Obtain regression equation of Y on X and estimate Y when X=55 from the following
Solution:
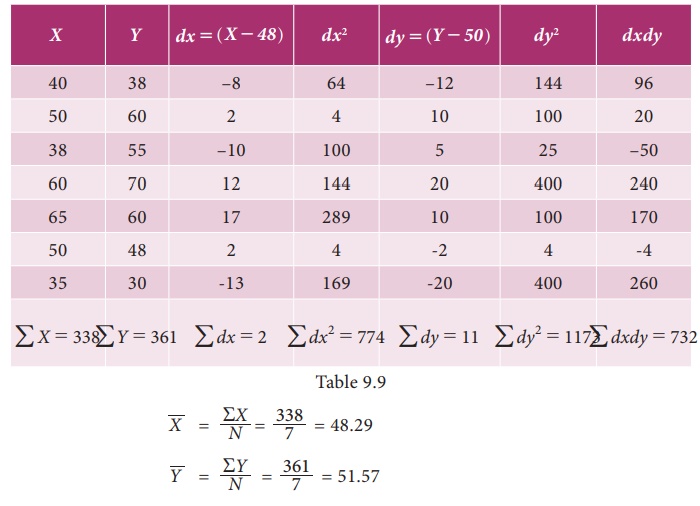
(i) Regression coefficients of Y on X
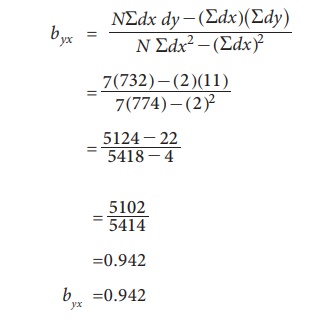
(ii) Regression equation of Y on X
YŌĆō51.57 = 0.942(XŌĆō48.29 )
Y = 0.942XŌĆō45.49+51.57=0.942 #ŌĆō45.49+51.57
Y = 0.942X+6.08
The regression equation of Y on X is Y= 0.942X+6.08 Estimation of Y when X= 55
Y= 0.942(55)+6.08=57.89
Example 9.12
Find the means of X and Y variables and the coefficient of correlation between them from the following two regression equations:
2YŌĆōXŌĆō50 = 0
3YŌĆō2XŌĆō10 = 0.
Solution:
We are given
2YŌĆōXŌĆō50 = 0 ... (1)
3YŌĆō2XŌĆō10 = 0 ... (2)
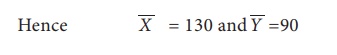
Solving equation (1) and (2)
We get Y = 90
Putting the value of Y in equation (1)
We get X = 130
Calculating correlation coefficient
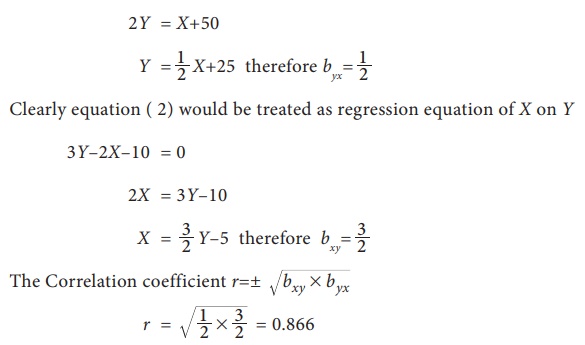
Let us assume equation (1) be the regression equation of Y on X
2Y = X+50
NOTE
It may be noted that in the above problem one of the regression coefficient is greater than 1 and the other is less than 1. Therefore our assumption on given equations are correct.
Example 9.13
Find the means of X and Y variables and the coefficient of correlation between them from the following two regression equations:
4XŌĆō5Y+33 = 0
20XŌĆō9YŌĆō107 = 0
Solution:
We are given
4XŌĆō5Y+33 = 0 ... (1)
20XŌĆō9YŌĆō107 = 0 ... (2)
Solving equation (1) and (2)
We get Y = 17
Putting the value of Y in equation (1)
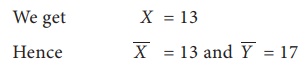
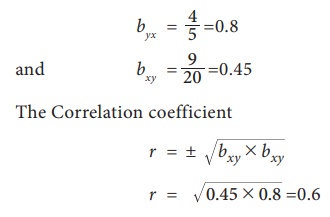
Calculating correlation coefficient
Let us assume equation (1) be the regression equation of X on Y
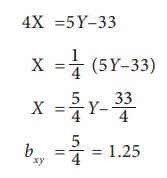
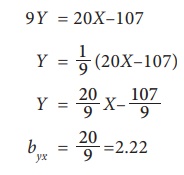
Let us assume equation (2) be the regression equation of Y on X
But this is not possible because both the regression coefficient are greater than
So our above assumption is wrong. Therefore treating equation (1) has regression equation of Y on X and equation (2) has regression equation of X on Y . So we get
Example 9.14
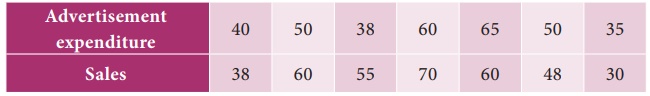
The following table shows the sales and advertisement expenditure of a form
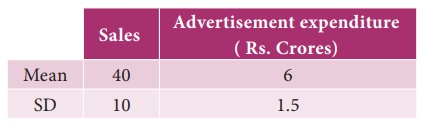
Coefficient of correlation r= 0.9. Estimate the likely sales for a proposed advertisement expenditure of Rs. 10 crores.
Solution:
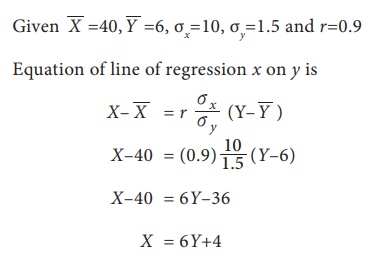
When advertisement expenditure is 10 crores i.e., Y=10 then sales X=6(10)+4=64 which implies sales is 64.
Example 9.15
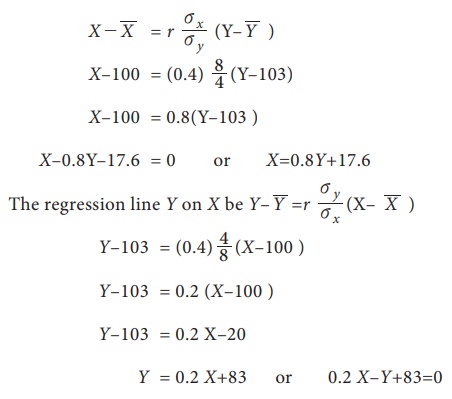
There are two series of index numbers P for price index and S for stock of the commodity. The mean and standard deviation of P are 100 and 8 and of S are 103 and 4 respectively. The correlation coefficient between the two series is 0.4. With these data obtain the regression lines of P on S and S on P.
Solution:
Let us consider X for price P and Y for stock S. Then the mean and SD for P is considered as X-Bar = 100 and Žāx=8. respectively and the mean and SD of S is considered as Y-Bar =103 and Žāy=4. The correlation coefficient between the series is r(X,Y)=0.4
Let the regression line X on Y be
Example 9.16
For 5 pairs of observations the following results are obtained ŌłæX=15, ŌłæY=25, ŌłæX2 =55, ŌłæY2 =135, ŌłæXY=83 Find the equation of the lines of regression and estimate the value of X on the first line when Y=12 and value of Y on the second line if X=8.
Solution:
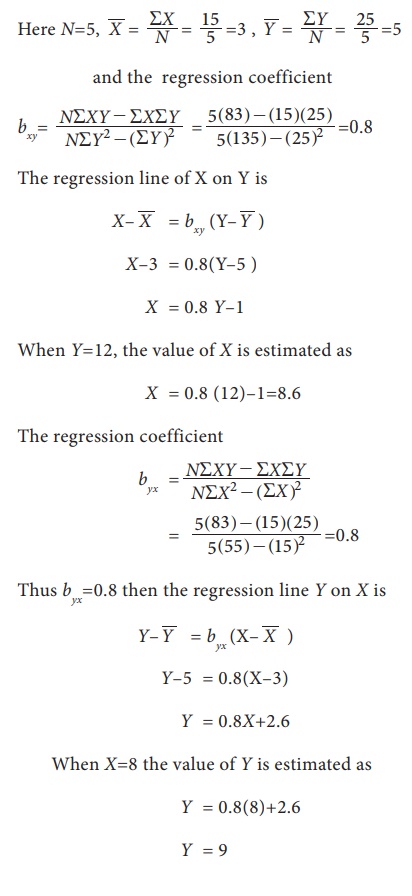
YŌĆō5 = 0.8(XŌĆō3)
= 0.8X+2.6
When X=8 the value of Y is estimated as
= 0.8(8)+2.6
= 9
Example 9.17
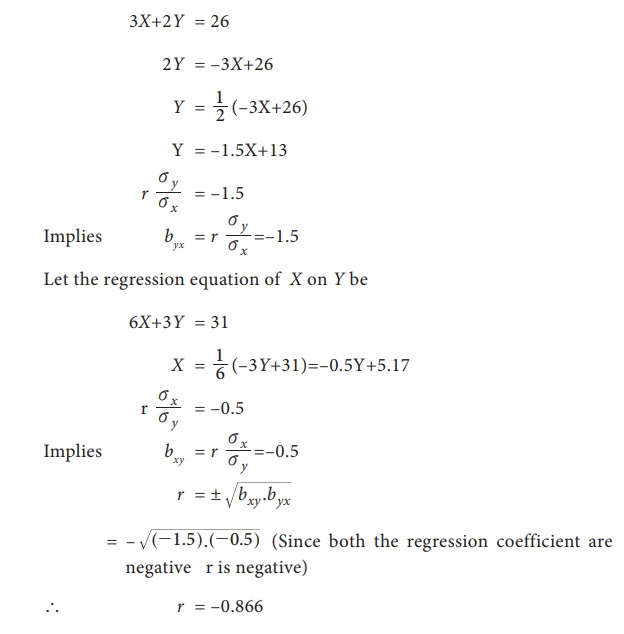
The two regression lines are 3X+2Y=26 and 6X+3Y=31. Find the correlation coefficient.
Solution:
Let the regression equation of Y on X be
3X+2Y = 26
Example 9.18
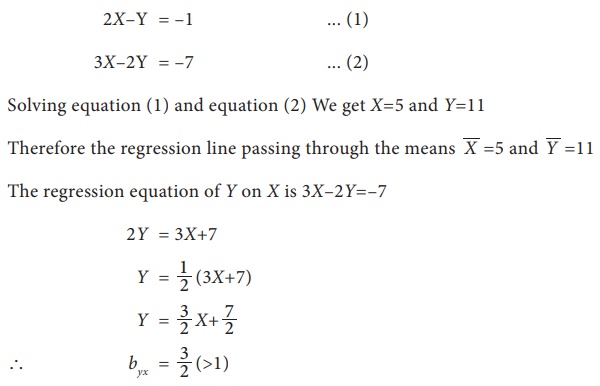
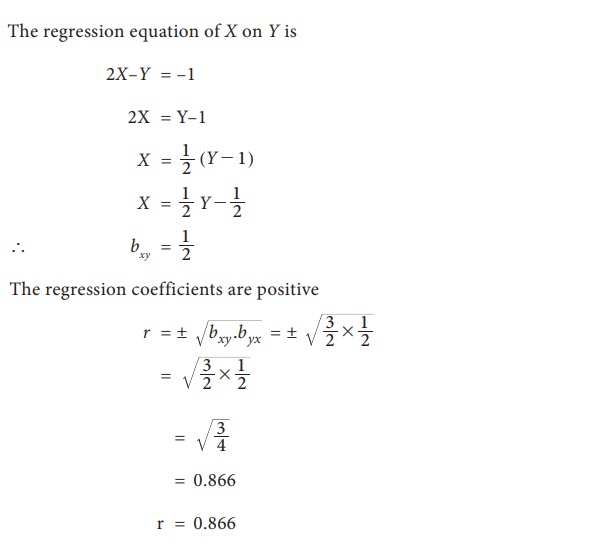
In a laboratory experiment on correlation research study the equation of the two regression lines were found to be 2XŌĆōY+1=0 and 3XŌĆō2Y+7=0 . Find the means of X and Y. Also work out the values of the regression coefficient and correlation between the two variables X and Y.
Solution:
Solving the two regression equations we get mean values of X and Y
Example 9.19
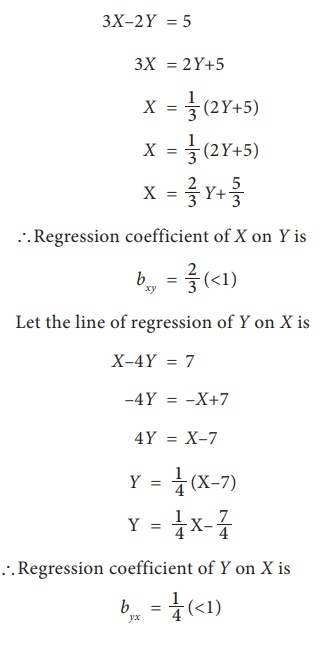
For the given lines of regression 3XŌĆō2Y=5and XŌĆō4Y=7. Find
(i) Regression coefficients
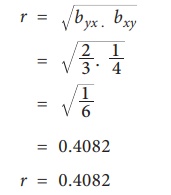
(ii) Coefficient of correlation
Solution:
(i) First convert the given equations Y on X and X on Y in standard form and find their regression coefficients respectively.
Given regression lines are
3XŌĆō2Y = 5 ... (1)
XŌĆō4Y = 7 ... (2)
Let the line of regression of X on Y is
3XŌĆō2Y = 5
3X = 2Y+5
Coefficient of correlation
Since the two regression coefficients are positive then the correlation coefficient is also positive and it is given by
Exercise 9.2
1. From the data given below
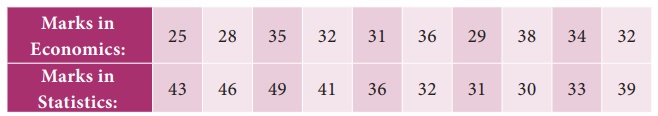
Find (a) The two regression equations, (b) The coefficient of correlation between marks in Economics and statistics, (c) The mostly likely marks in Statistics when the marks in Economics is 30.
2. The heights ( in cm.) of a group of fathers and sons are given below
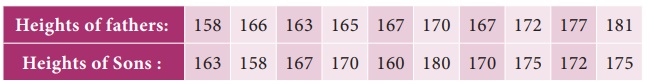
Find the lines of regression and estimate the height of son when the height of the father is 164 cm.
3. The following data give the height in inches (X) and the weight in lb. (Y) of a random sample of 10 students from a large group of students of age 17 years:
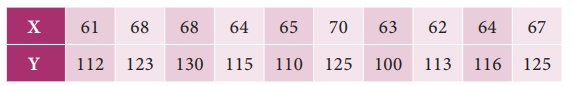
Estimate weight of the student of a height 69 inches.
4. Obtain the two regression lines from the following data N=20, ŌłæX=80, ŌłæY=40, ŌłæX2=1680, ŌłæY2=320 and ŌłæXY=480
5. Given the following data, what will be the possible yield when the rainfall is 29Ōé╣Ōé╣
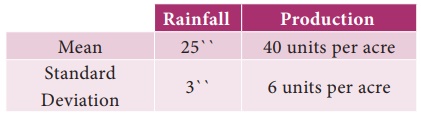
Coefficient of correlation between rainfall and production is 0.8
6. The following data relate to advertisement expenditure(in lakh of rupees) and their corresponding sales( in crores of rupees)
Estimate the sales corresponding to advertising expenditure of Rs. 30 lakh.
7. You are given the following data:
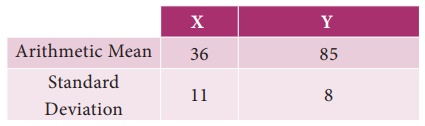
If the Correlation coefficient between X and Y is 0.66, then find (i) the two regression coefficients, (ii) the most likely value of Y when X=10
8. Find the equation of the regression line of Y on X, if the observations ( Xi, Yi) are the following (1,4) (2,8) (3,2) ( 4,12) ( 5, 10) ( 6, 14) ( 7, 16) ( 8, 6) (9, 18)
9. A survey was conducted to study the relationship between expenditure on accommodation (X) and expenditure on Food and Entertainment (Y) and the following results were obtained:
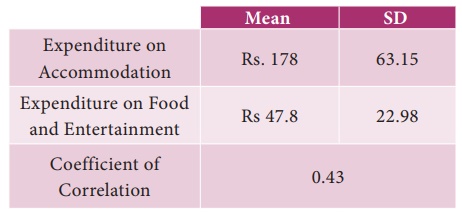
Write down the regression equation and estimate the expenditure on Food and Entertainment, if the expenditure on accommodation is Rs. 200.
10. For 5 observations of pairs of (X, Y) of variables X and Y the following results are obtained. ŌłæX=15, ŌłæY=25, ŌłæX2=55, ŌłæY2=135, ŌłæXY=83. Find the equation of the lines of regression and estimate the values of X and Y if Y=8 ; X=12.
11. The two regression lines were found to be 4XŌĆō5Y+33=0 and 20XŌĆō9YŌĆō107=0 . Find the mean values and coefficient of correlation between X and Y.
12. The equations of two lines of regression obtained in a correlation analysis are the following 2X=8ŌĆō3Y and 2Y=5ŌĆōX . Obtain the value of the regression coefficients and correlation coefficient.
Related Topics