Chapter: Modern Analytical Chemistry: The Language of Analytical Chemistry
Selecting an Analytical Method
Selecting an
Analytical Method
A method is the application of a technique to a specific analyte in a specific matrix. Methods for determining the concentration of lead in drinking water
can be devel- oped using any of the techniques mentioned in the previous
section. Insoluble lead salts such as PbSO4 and PbCrO4 can form the basis for a gravimetric method. Lead forms several
soluble complexes that can be used in a complexation titrimetric method or, if the complexes are highly absorbing, in a spectrophotometric method. Lead in the gaseous free-atom state can be measured by an atomic
ab- sorption spectroscopic method.
Finally, the availability of multiple oxidation
states (Pb, Pb2+, Pb4+)
makes coulometric, potentiometric, and voltammetric methods feasible.
The requirements of the analysis
determine the best method. In choosing a method, consideration is given
to some or all the following design
criteria: accuracy,
precision, sensitivity, selectivity, robustness, ruggedness, scale of
operation, analysis time, availability of equipment, and
cost. Each of these criteria is considered in more
detail in the following sections.
Accuracy
Accuracy is
a measure of how closely
the result of an experiment agrees with the ex-
pected result. The difference between
the obtained result
and the expected
result is usually divided
by the expected result and reported as a percent
relative error
Analytical methods may be divided
into three groups based on the
magnitude of their relative errors.3 When an experimental result
is within 1% of the correct
result, the analytical method is highly ac-
curate. Methods resulting in relative errors
between 1% and
5% are moderately accurate, but methods of low accuracy produce rel- ative errors
greater than 5%.
The magnitude of a method’s
relative error depends
on how accurately the signal is measured, how accurately the value of k in
equations 3.1 or 3.2 is known, and the ease of handling
the sample without loss or contamination. In general, total analysis methods produce results of high accuracy, and concentration methods
range from high to low accuracy.
Precision
When a sample
is analyzed several
times, the individual results are rarely
the same. Instead, the
results are randomly scattered. Precision
is a measure
of this variability. The closer the agreement between individual analyses, the more precise
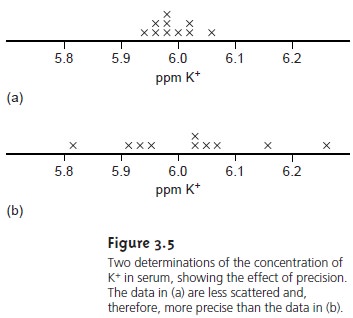
the results. For example,
in determining the concentration of K+ in
serum, the results
shown in Figure 3.5(a)
are more precise
than those in Figure 3.5(b).
It is important to realize that precision does not imply accuracy. That the data in Figure
3.5(a) are more pre-
cise does not mean that
the first set
of results is more accurate. In fact, both
sets of results may be very inaccurate.
As with accuracy,
precision depends on those factors
affecting the relationship between the signal and the analyte
(equations 3.1 and 3.2). Of particular impor- tance are the uncertainty in measuring the signal and the ease of handling
samples reproducibly. In most cases the signal for a total analysis method can be measured
with a higher precision than the corresponding signal for a concentration method.
Sensitivity
The ability to demonstrate that two samples
have different amounts
of analyte is an
essential part of many analyses.
A method’s sensitivity
is a measure of its ability to establish that such differences are significant. Sensitivity is often confused
with a method’s detection limit.4 The detection limit is the smallest amount
of analyte that can be determined with confidence. The detection limit,
therefore, is a statisti-
cal parameter.
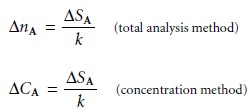
Sensitivity is the change
in signal per unit change
in the amount of analyte
and is equivalent to the proportionality constant, k, in equations 3.1 and 3.2. If ∆SA is the
smallest increment in signal that can be measured, then the smallest
difference in the amount
of analyte that
can be detected is
Suppose that for a particular total
analysis method the signal is a measurement of mass using a balance whose
smallest increment is ±0.0001 g. If the method’s sensitivity
is 0.200, then the method can conceivably detect a difference
of as little as
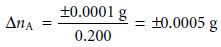
in the absolute
amount of analyte
in two samples. For methods
with the same ∆SA, the method with the greatest sensitivity is best able to discriminate among smaller amounts
of analyte.
Selectivity
An analytical method
is selective if its signal
is a function of only
the amount of an-
alyte present in the sample.
In the presence of an interferent, equations
3.1 and 3.2 can be expanded
to include a term corresponding to the interferent’s contribution to the signal,
SI,
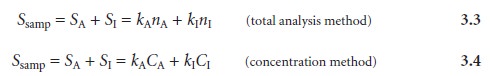
where Ssamp is the total
signal due to constituents in the sample;
kA and
kI are
the sensitivities for the
analyte and the
interferent, respectively; and nI and CI are the moles (or grams) and concentration of the interferent in the sample.
The
selectivity of
the method for the interferent relative to the analyte is de-
fined by a selectivity coefficient, KA,I
 3.5
3.5
which may be positive or negative depending on whether the
interferent’s effect on
the signal is opposite that of the analyte.* A selectivity coefficient greater than +1 or
less than –1 indicates that the method
is more selective for the interferent than for the analyte.
Solving equation 3.5 for kI
kI = KA,I x kA …………..3.6
substituting into equations 3.3 and 3.4, and simplifying gives
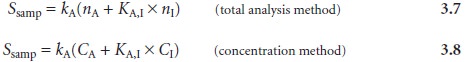
The
selectivity coefficient is easy to calculate if kA and kI can be independently determined. It is also possible to calculate KA,I by measuring Ssamp in the presence and absence of known
amounts of analyte
and interferent.
Knowing the selectivity coefficient provides a useful way to
evaluate an inter- ferent’s potential effect on an analysis. An interferent will not pose a problem
as long as the term KA,I x nI in equation 3.7 is significantly smaller than nA, or KA,I x CI in equation 3.8 is significantly smaller
than CA.
Not surprisingly, methods
whose signals depend
on chemical reactivity are often less selective and, therefore, more
susceptible to interferences. Problems with selec-
tivity become even greater when the analyte
is present at a very low concentration.
Robustness and Ruggedness
For a method to be useful it must provide
reliable results. Unfortunately, methods are subject to a variety
of chemical and
physical interferences that
contribute uncer- tainty to the analysis. When a method
is relatively free from chemical
interferences, it can be applied to the determination of analytes in a wide
variety of sample
matri- ces. Such methods
are considered robust.
Random variations in experimental conditions also introduce uncertainty. If a method’s sensitivity is highly dependent on experimental conditions, such as tem- perature, acidity, or reaction time, then slight
changes in those
conditions may lead to
significantly different results.
A rugged method is relatively insensitive to changes in
experimental conditions.
Scale of Operation
Another way to narrow the choice of methods is to consider
the scale on which the analysis must be conducted. Three limitations of particular importance are the amount
of sample available for the analysis, the concentration of analyte in the
sample, and the absolute amount
of analyte needed
to obtain a measurable signal. The first and second
limitations define the scale of operations shown
in Figure 3.6; the
last limitation positions a method within
the scale of operations.
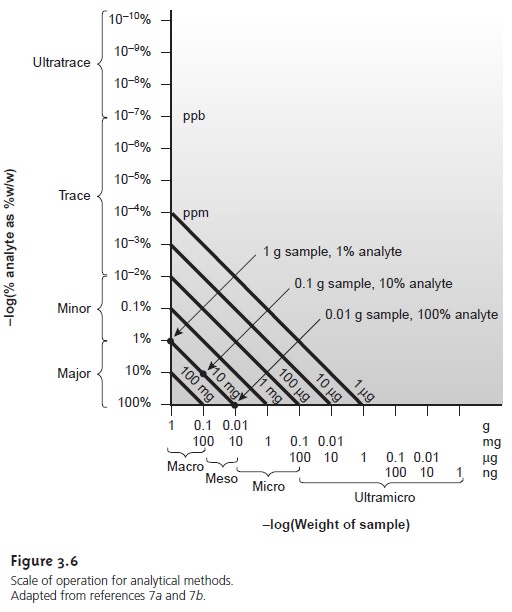
The scale of operations in Figure 3.6 shows the analyte’s concentration in weight percent on the y-axis and the sample’s size on the x-axis. For convenience, we divide analytes into major (>1% w/w), minor (0.01% w/w – 1% w/w), trace (10–7% w/w – 0.01% w/w) and ultratrace (<10–7% w/w) components, and we divide samples into macro (>0.1 g), meso (10 mg – 100 mg), micro (0.1 mg – 10 mg) and ultramicro (<0.1 mg) sample sizes. Note that both the x-axis and the y-axis use a logarithmic scale. The analyte’s concentration and the amount of sample used provide a characteristic description for an analysis. For example, samples in a macro–major analysis weigh more than 0.1 g and contain more than 1% analyte.
Diagonal lines connecting the two axes show combinations of sample size and
concentration of analyte
containing the same absolute amount
of analyte. As shown
in
Figure 3.6, for example, a 1-g sample containing
1% analyte has the same amount of analyte (0.010
g) as a 100-mg sample
containing 10% analyte
or a 10-mg sample containing 100% analyte.
Since total analysis methods
respond to the
absolute amount of analyte in a
sample, the diagonal lines provide
an easy way to define
their limitations. Consider, for example, a hypothetical total analysis method for which the minimum de- tectable signal
requires 100 mg of analyte.
Using Figure 3.6, the diagonal
line repre- senting 100
mg suggests that
this method is best suited
for macro samples
and major analytes. Applying the method
to a minor analyte with
a concentration of 0.1%
w/w requires a sample of at least
100 g. Working
with a sample
of this size
is rarely practical, however,
due to the complications of carrying such a large
amount of material through the analysis. Alternatively, the minimum
amount of required analyte can be decreased by improving the limitations associated with measuring the signal.
For example, if the signal is a measurement of mass, a decrease
in the minimum amount of analyte can be accomplished by switching from a con- ventional analytical balance, which
weighs samples to ±0.1 mg, to a semimicro
(±0.01 mg) or microbalance (±0.001
mg).
Concentration methods frequently have both lower
and upper limits
for the amount of analyte that can be determined. The lower limit
is dictated by the small- est concentration of analyte
producing a useful
signal and typically is in the parts
per million or parts per billion concentration range. Upper concentration limits exist when the sensitivity of the analysis
decreases at higher
concentrations.
An upper concentration level is important because it determines how a sam- ple
with a high
concentration of analyte
must be treated
before the analysis. Con- sider, for example,
a method with an upper
concentration limit of 1 ppm (micro-
grams per milliliter). If the method requires
a sample of 1 mL, then the upper limit on the
amount of analyte
that can be handled is 1 μg.
Using Figure 3.6,
and following the diagonal line for 1 μg of analyte, we find that
the analysis of an ana- lyte present at a concentration of 10% w/w requires a sample of only 10 μg! Ex- tending such an analysis
to a major analyte, therefore, requires the ability
to ob- tain and work with very small
samples or the ability to dilute the original sample accurately. Using this example,
analyzing a sample for an analyte whose concen-
tration is 10% w/w requires a 10,000-fold dilution. Not surprisingly, concentra- tion methods are most commonly used for minor,
trace, and ultratrace analytes, in macro and meso samples.
Equipment, Time, and Cost
Finally, analytical methods
can be compared in terms of their need for equipment,
the time required to complete an analysis, and
the cost per
sample. Methods relying on instrumentation are equipment-intensive and may require
significant operator training. For
example, the graphite
furnace atomic absorption spectroscopic method for determining lead levels in water requires
a significant capital
investment in the instrument and an experienced operator to obtain
reliable results. Other methods, such as titrimetry, require only simple
equipment and reagents
and can be learned quickly.
The time needed to complete
an analysis for a single sample is often fairly simi-
lar from method to method.
This is somewhat misleading, however,
because much of this time is spent preparing the solutions and equipment needed
for the analysis. Once the solutions and equipment are in place, the number of samples
that can be analyzed per hour differs
substantially from method
to method. This is a significant
factor in selecting a method
for laboratories that handle a high volume
of samples.
The cost of an analysis is determined by many factors, including the cost
of necessary equipment and reagents, the cost of hiring analysts,
and the number of samples that
can be processed per hour. In general, methods
relying on instruments cost more per sample than other methods.
Making the Final Choice
Unfortunately, the design
criteria discussed earlier
are not mutually
independent.8 Working with smaller
amounts of analyte
or sample, or improving selectivity, often comes at the expense of precision. Attempts
to minimize cost and analysis
time may decrease accuracy.
Selecting a specific method requires a careful balance among these design
criteria. Usually, the most important design criterion is accuracy, and the
best method is that capable
of producing the most accurate
results. When the need
for results is urgent, as is often
the case in clinical labs,
analysis time may be-
come the critical factor.
The
best method is often dictated
by the sample’s properties. Analyzing
a sam- ple with a complex
matrix may require
a method with excellent selectivity to avoid interferences. Samples
in which the analyte is present at a trace
or ultratrace con- centration usually must be analyzed by a concentration method. If the quantity of sample
is limited, then
the method must
not require large
amounts of sample.
Determining the concentration of lead in drinking water
requires a method that can detect lead at the parts per billion concentrations. Selectivity is also im-
portant because other
metal ions are
present at significantly higher concentrations.
Graphite furnace atomic absorption spectroscopy is a commonly
used method for determining lead levels in drinking water
because it meets
these specifications. The same
method is also
used in determining lead levels in blood, where
its ability to detect low concentrations of lead using
a few microliters of sample
are important considerations.
Related Topics