Chapter: Mechanical : Engineering Economics & Cost Analysis : Replacement And Maintenance Analysis
Replacement And Maintenance Analysis
REPLACEMENT AND MAINTENANCE ANALYSIS
Introduction
Organizations providing
goods/services use several facilities like equipment and machinery which are
directly required in their operations. In addition to these facilities, there
are several other items which are necessary to facilitate the functioning of
organizations.
All such facilities should be
continuously monitored for their efficient functioning; otherwise, the quality
of service will be poor. Besides the quality of service of the facilities, the
cost of their operation and maintenance would increase with the passage of
time.
Hence, it is an absolute necessity
to maintain the equipment in good operating conditions with economical cost.
Thus, we need an integrated approach to minimize the cost of maintenance. In
certain cases, the equipment will be obsolete over a period of time.
If a firm wants to be in the same
business competitively, it has to take decision on whether to replace the old
equipment or to retain it by taking the cost of maintenance and operation into
account.
There are two basic reasons for
considering the replacement of an equipment physical impairment of the various
parts or obsolescence of the equipment.
Physical impairment refers only to
changes in the physical condition of the machine itself. This would lead to a
decline in the value of the service rendered, increased operating cost,
increased maintenance cost or a combination of these.
Obsolescence is due to improvement
of the tools of production, mainly improvement in technology.
So, it would be uneconomical to
continue production with the same machine under any of the above situations.
Hence, the machines are to be periodically replaced.
Sometimes, the capacity of existing
facilities may be inadequate to meet the current demand. Under such situation,
the following alternatives will be considered.
ü Replacement of the existing equipment with a new one.
ü Augmenting the existing one with an additional equipment.
Types of Maintenance
Maintenance activity can be classified into two types:
ü Preventive maintenance and
ü Breakdown maintenance.
Preventive maintenance (PM) is the
periodical inspection and service activities which are aimed to detect
potential failures and perform minor adjustments or repairs which will prevent
major operating problems in future.
Breakdown maintenance is the repair
which is generally done after the equipment has attained down state. It is
often of an emergency nature which will have associated penalty in terms of
expediting cost of maintenance and down time cost of equipment.
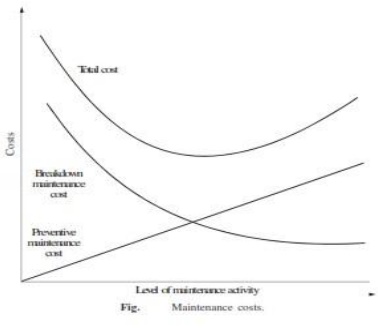
Preventive maintenance will reduce
such cost up to a point. Beyond that point, the cost of preventive maintenance
will be more when compared to the breakdown maintenance cost.
The total cost, which is the sum of
the preventive maintenance cost and the breakdown maintenance cost, will go on
decreasing with an increase in the level of maintenance up to a point.
Beyond that point, the total cost
will start increasing. The level of maintenance corresponding to the minimum
total cost is the optimal level of maintenance. The concepts are demonstrated
in Fig
Types of Replacement Problem
Replacement study can be classified into two
categories:
(a) Replacement of assets that deteriorate with time
(Replacement due to gradual failure, or wear and tear of the components of the
machines).
This can be further classified into the following types:
(i) Determination of economic life of an asset.
(ii) Replacement of an existing asset with a new asset.
(b) Simple probabilistic model for assets which fail completely
(replacement due to sudden failure).
Determination of Economic Life of an
Asset
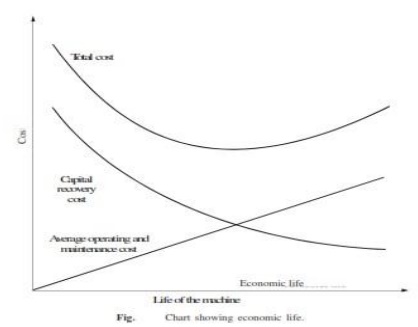
Any asset will have the following cost components:
ü Capital recovery cost (average first cost), computed from the
first cost (purchase price) of the machine.
ü Average operating and maintenance cost (O & M cost)
Total cost which is the sum of capital recovery
cost (average first cost) and average maintenance cost.
EXAMPLE
A firm is considering replacement of
an equipment, whose first cost is Rs. 4,000 and the scrap value is negligible
at the end of any year. Based on experience, it was found that the maintenance
cost is zero during the first year and it increases by Rs. 200 every year
thereafter.
(a) When should the equipment be replaced if i = 0%?
(b) When should the equipment be replaced if i = 12%?
(a) When i = 0%. In this problem
(i)
First cost = Rs. 4,000
(ii)
Maintenance cost is Rs. 0 during the
first year and it increases by Rs. 200 every year thereafter.
This is summarized in column B of Table
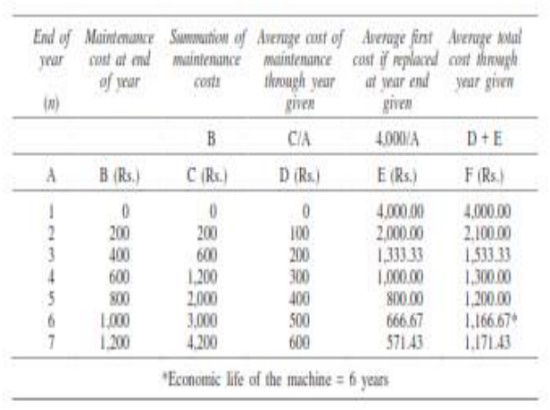
Column C summarizes the summation of maintenance
costs for each replacement period. The value corresponding to any end of year
in this column represents the total maintenance cost of using the equipment
till the end of that particular year.
Average total cost = [ First cost (FC) + Summation
of maintenance cost ] / Replacement period
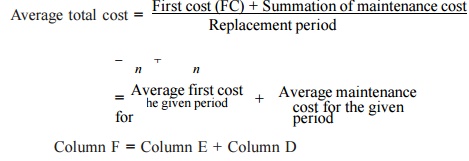
Column F = Column E + Column D
The value corresponding to any end
of year (n) in Column F represents the average total cost of using the
equipment till the end of that particular year.
For this problem, the average total
cost decreases till the end of year 6 and then it increases. Therefore, the
optimal replacement period is six years, i.e. economic life of the equipment is
six years.
(b) When interest rate, i =
12%. When the interest rate is more than 0%, the steps to be taken for getting
the economic life are summarized with reference to Table
Table Calculations to Determine Economic Life (First cost = Rs. 4,000,
Interest = 12%)
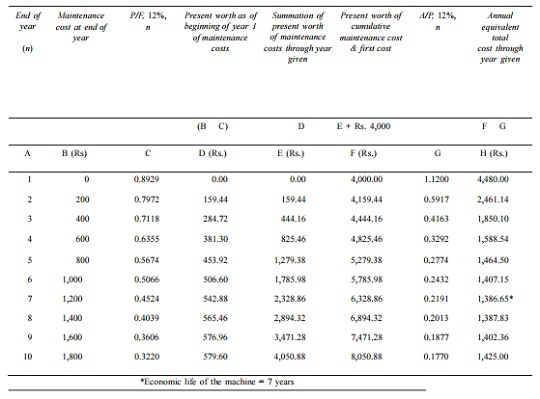
The steps are summarized now:
1. Discount the maintenance costs to the beginning
of year 1.
Column D = Column B
1/ (1 + i)n
= Column B
(P/F, i, n) = Column B Column
C.
2. Find the summation of present worth of
maintenance costs through the year given (Column E = Column D).
3. Find Column F by adding the first cost of Rs.
4,000 to Column E.
4. Find the annual equivalent total cost through the
years given.
Column H = Column F i(1
+ i)n / (1 + i)n − 1
= Column F (A/P,
12%, n) = Column F Column G
5. Identify the end of year for which the annual
equivalent total cost is minimum.
For this problem, the annual equivalent total cost
is minimum at the end of year 7. Therefore, the economic life of the equipment
is seven years.
Replacement Of Exist Ing Asset With
A New Asset
In this section, the c oncept of
comparison of replacement of an existing asset with a new asset is presented.
In this analysis, the annual equivalent cost of each alternative should be co
mputed first.
Then the alternative which has the
least cost should be selected as the best alternative. Before discu ssing
details, some preliminary concepts whic h are essential for this type of
replacem ent analysis are presented.
Capital Recovery with Return
Consider the follow ing data of a machine.
Let
P = purchase priice of the machine,
F = salvage valu e of the machine at
the end of machine life,
n = life of the m achine in years, and
i = interest rate,, compounded
annually
The corresponding cash flow diagram is shown in Fig
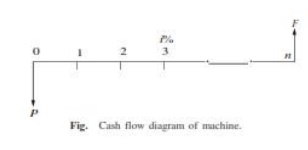
The equation for the annual
equivalent amount for the above cash flow diagram is
AE(i) = (P – F ) (A/P,
i, n) + F i
This equation represents the capital recovery
with return.
Concept of Challenger and Defender
o If an existing equipment is considered for replacement with a
new equipment, then the existing equipment is known as the defender and
the new equipment is known as challenger.
o Assume that an equipment has been purchased about three years
back for Rs. 5,00,000 and it is considered for replacement with a new
equipment. The supplier of the new equipment will take the old one for some
money, say, Rs. 3,00,000.
o This should be treated as the present value of the existing
equipment and it should be considered for all further economic analysis.
o
The purchase value of the existing
equipment before three years is now known as sunk cost, and it should
not be considered for further analysis.
EXAMPLE
Two years ago, a machine was
purchased at a cost of Rs. 2,00,000 to be useful for eight years. Its salvage
value at the end of its life is Rs. 25,000. The annual maintenance cost is Rs.
25,000.
The market value of the present
machine is Rs. 1,20,000. Now, a new machine to cater to the need of the present
machine is available at Rs. 1,50,000 to be useful for six years. Its annual
maintenance cost is Rs. 14,000. The salvage value of the new machine is Rs.
20,000.
Using an interest rate of 12%, find
whether it is worth replacing the present machine with the new machine.
Solution
Alternative 1—
Present machine
Purchase price = Rs. 2,00,000
Present value (P) = Rs. 1,20,000
Salvage value (F) = Rs. 25,000
Annual maintenance cost (A) = Rs. 25,000
Remaining life = 6 years
Interest rate = 12%
The cash flow diagram of the present machine is
illustrated in Fig.
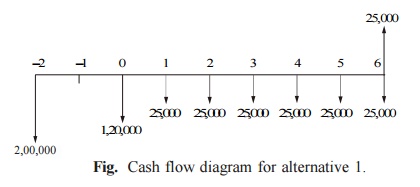
Fig. Cash flow diagram for alternative 1.
annual maintenance cost for the preceding
periods are not shown in this figure. The annual equivalent cost is computed as
AE(12%) = (P – F)(A/P,
12%, 6) + F i + A
= (1,20,000 – 25,000)(0.2432) + 25,000 0.12 + 25,000
= Rs. 51,104
Alternative 2 —
New machine
Purchase price (P) = Rs. 1,50,000
Salvage value (F) = Rs. 20,000
Annual maintenance cost (A) = Rs. 14,000
Life = 6 years
Interest rate = 12%
The cash flow diagram of the new machine is
depicted in Fig.
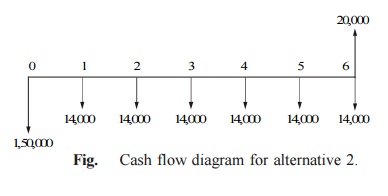
Fig. Cash flow diagram
for alternative 2.
The formula for the annual equivalent cost is
AE(12%) = (P – F)(A/P,
12%, 6) + F i + A
= (1,50,000 – 20,000)(0.2432) + 20,000
0.12 + 14,000
= Rs. 48,016
Since the annual equivalent cost of
the new machine is less than that of the present machine, it is suggested that
the present machine be replaced with the new machine.
Simple Probabilistic Model For Items Which Fail Completely
Electronic items like transistors,
resistors, tubelights, bulbs, etc. could fail all of a sudden, instead of
gradual deterioration. The failure of the item may result in complete breakdown
of the system. The system may contain a collection of such items or just one
item, say a tubelight.
Therefore, we use some replacement
policy for such items which would avoid the possibility of a complete
breakdown.
The following are the replacement
policies which are applicable for this situation.
(i) Individual replacement policy. Under this policy, an item is
replaced immediately after its failure.
(ii) Group replacement policy.
Under this policy, the following decision is
made:
At what equal intervals are all the
items to be replaced simultaneously with a provision to replace the items
individually which fail during a fixed group replacement period?
There is a trade-off between the individual
replacement policy and the group replacement policy. Hence, for a given
problem, each of the replacement policies is evaluated and the most economical
policy is selected for implementation. This is explained with two numerical
problems.
EXAMPLE
The failure rates of transistors in a computer
are summarized in Table .
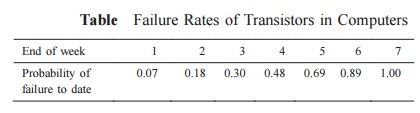
The cost of replacing an individual
failed transistor is Rs. 9. If all the transistors are replaced simultaneously,
it would cost Rs. 3.00 per transistor. Any one of the following two options can
be followed to replace the transistors:
(a) Replace the transistors individually when they fail (individual
replacement policy).
(b) Replace all the transistors simultaneously at fixed intervals
and replace the individual transistors as they fail in service during the fixed
interval (group replacement policy).
Find out the optimal replacement
policy, i.e. individual replacement policy or group replacement policy. If
group replacement policy is optimal, then find at what equal intervals should
all the transistors be replaced.
Solution
Assume that there are 100 transistors in use.
Let,
pi be the probability that a transistor which was new when placed
in position for use, fails during the ith week of its life. Hence,
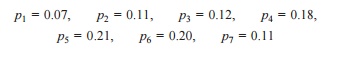
Since the sum of pis
is equal to 1 at the end of the 7th week, the transistors are sure to fail
during the seventh week.
Assume that
(a) transistors that fail during a week are replaced just before the
end of the week, and
(b) the actual percentage of failures during a week for a sub-group
of transistors with the same age is same as the expected percentage of failures
during the week for that sub-group of transistors.
Let
Ni = the number of transistors replaced at the end of the ith
week
N0 = number
of transistors replaced at the end of the week 0 (or at the beginning of
the first week).
= 100
N1 = number of
transistors replaced at the end of the 1st week
= N0 p1 = 100 0.07
= 7
N2 = number of
transistors replaced at the end of the 2nd week
= N0 p2 + N1 p1
= 100 0.11 + 7 0.07 =
12
N3 = N0 p3 + N1 p2
+ N2 p1
= 100 0.12 + 7 0.11 +
12 0.07
= 14
N4 = N0 p4 + N1 p3
+ N2 p2 + N3 p1
= 100 0.18 + 7 0.12 +
12 0.11 + 14 0.07
= 21
N5 = N0 p5 + N1 p4
+ N2 p3 + N3 p2 + N4
p1
= 100 0.21 + 7 0.18 +
12 0.12 + 14 0.11 + 21 0.07
= 27
N6 = N0 p6 + N1 p5
+ N2 p4 + N3 p3 + N4 p2 + N5 p1
= 100 0.2 + 7 0.21
+ 12 0.18 + 14 0.12 + 21 0.11
+ 27 0.07
= 30
N7 = N0 p7 + N1 p6
+ N2 p5 + N3 p4 + N4 p3 + N5 p2
+ N6 p1
= 100 0.11 + 7 0.2
+ 12 0.21 + 14 0.18 + 21 0.12
+ 27 0.11 + 30 0.07
= 25
Calculation of
individual replacement cost
Expected life of
each transistor = 
= 1 0.07 + 2 0.11 + 3
0.12 + 4 0.18
+ 5 0.21 + 6 0.2 + 7
0.11
= 4.39 weeks
Average No. of failures/week = 100/4.39 = 23
(approx.) Therefore,
Cost of individual replacement
= (No. of
failures/week Individual replacement cost/transistor) = 23 9 = Rs. 207.
Determination of group replacement
cost
Cost of transistor when replaced
simultaneously = Rs. 3
Cost of transistor when replaced individually = Rs. 9
The costs of group replacement
policy for several replacement periods are summarized in Table.
Table Calculations of
Cost for Preventive Maintenance
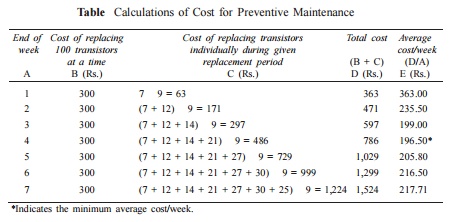
From Table it is
clear that the average cost/week is minimum for the fourth week. Hence, the
group replacement period is four weeks.
Individual replacement cost/week = Rs. 207
Minimum group replacement cost/week = Rs. 196.50
Since the minimum
group replacement cost/week is less than the individual replacement cost/week,
the group replacement policy is the best, and hence all the transistors should
be replaced once in four weeks and the transistors which fail during this
four-week period are to be replaced individually.
Related Topics