Maths - Regression Analysis | 11th Business Mathematics and Statistics(EMS) : Chapter 9 : Correlation and Regression analysis
Chapter: 11th Business Mathematics and Statistics(EMS) : Chapter 9 : Correlation and Regression analysis
Regression Analysis
Regression Analysis
Introduction:
So far we have studied
correlation analysis which measures the direction and strength of the
relationship between two variables. Here we can estimate or predict the value
of one variable from the given value of the other variable. For instance, price
and supply are correlated. We can find out the expected amount of supply for a
given price or the required price level for attaining the given amount of
supply.
The term
ŌĆ£ regressionŌĆØ literally means ŌĆ£ Stepping back towards the averageŌĆØ. It was
first used by British biometrician Sir Francis Galton (1822 -1911), in
connection with the inheritance of stature. Galton found that the offsprings of
abnormally tall or short parents tend to ŌĆ£regressŌĆØ or ŌĆ£step backŌĆØ to the
average population height. But the term ŌĆ£regressionŌĆØ as now used in Statistics
is only a convenient term without having any reference to biometry.
Definition 9.1
Regression analysis is a mathematical measure of the average
relationship between two or more variables in terms of the original units of
the data.
1. Dependent and independent variables
Definition 9.2
In regression analysis there are two types of variables. The variable
whose value is to be predicted is called dependent variable and the variable
which is used for prediction is called independent variable.
Regression
helps us to estimate the value of one variable, provided the value of the other
variable is given. The statistical method which helps us to estimate the
unknown value of one variable from the known value of the related variable is
called Regression.
2. Regression Equations
Regression
equations are algebraic expressions of the regression lines. Since there are
two regression lines, there are two regression equations. The regression
equation of X on Y is used to describe the variation in the values of X for given changes in Y and the regression equation of Y
on X is used to describe the
variation in the values of Y for
given changes in X. Regression
equations of (i) X on Y (ii) Y on X and their
coefficients in different cases are described as follows.
Case 1: When the actual values are taken
When we
deal with actual values of X and Y variables the two regression equations and
their respective coefficients are written as follows
(ii) Regression Equation of X on Y;
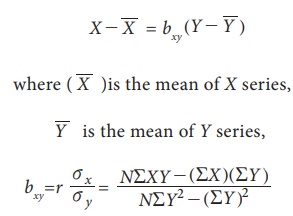
is known as the regression coefficient of X on Y, and r is the correlation coefficient between X and Y, Žāx and Žāy are standard deviations of
X and Y respectively.
(ii) Regression Equation of Y on X;
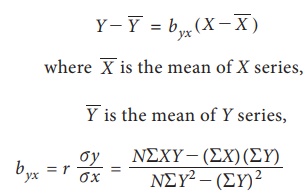
is known
as the regression coefficient of X on Y,
and r is the correlation coefficient
between X and Y, Žāx and Žāy are standard deviations of X and Y respectively.
Case 2 Deviations taken from Arithmetic means of X and Y
The
calculation can very much be simplified instead of dealing with the actual
values of X and Y, we take the deviations of X
and Y series from their respective
means. In such a case the two regression equations and their respective
coefficients are written as follows:
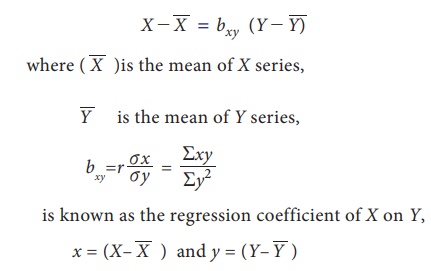
(i) Regression Equation of X on Y:
(ii)
Regression Equation of Y on X;

Note:
Instead of finding out the values of correlation coefficient Žāx, Žāy, etc, we can find the value of regression coefficient
by calculating Ōłæxy and Ōłæy2
Case 3 Deviations taken from Assumed Mean
When
actual means of X and Y variables are in fractions the
calculations can be simplified by taking the deviations from the assumed means.
The regression equations and their coefficients are written as follows
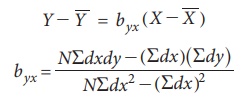
(i) Regression Equation of Y on X
(ii) Regression Equation of X on Y
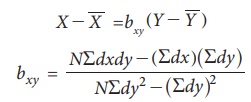
where dx=XŌĆōA,
dy=YŌĆōB, A and B are assumed means
or arbitrary values are taken from X and Y respectively.
Properties of Regression Coefficients
(i) Correlation
Coefficient is the geometric mean between the regression coefficients r = 
(ii) If
one of the regression coefficients is greater than unity, the other must be
less than unity.
(iii) Both
the regression coefficients are of same sign.
Related Topics