Chapter: Introduction to Human Nutrition: Energy Metabolism
Factors that influence energy expenditure
Factors that influence energy expenditure
Resting metabolic rate
Each of the components of energy expenditure is determined by various factors. RMR is highly variable between individuals (±25%), but is very consistent within individuals (<5%). Since RMR occurs pre-dominantly in muscle and the major organs of the body, the main source of individual variability in RMR is an individual’s amount of organ and muscle mass. Thus, fat-free mass (FFM; the total mass of the body that is not fat, i.e., predominantly organs and muscle) explains 60–80% of the variation in RMR between individuals. This concept can be explained using the woodstove analogy; the larger the wood-stove (or FFM), the larger the amount of heat pro-duction (or the larger the RMR). Since FFM is a het-erogeneous mixture of all nonfat body components, the metabolic rate associated with each kilogram of FFM is dependent on the quality of the FFM, in terms of hydration and relative contribution of the different organs that make up the FFM. For example, skeletal muscle constitutes approximately 43% of total mass in an adult, but contributes only 22–36% of the RMR, whereas the brain, which constitutes approximately only 2% of mass, contributes 20–24% of the RMR. In addition, the metabolic cost of each kilogram of FFM decreases with developmental progression, probably owing to developmental increases in the muscle mass to organ mass ratio within FFM. Thus, the relation-ship between RMR and FFM is not linear across all ages and is estimated to be 331.8 kJ/kg between the ages of 0 and 2.5 years, 151.2 kJ/kg in children aged 4–7 years, 88.2 kJ/kg during adolescence, and 151.2 kJ/ kg in adulthood.
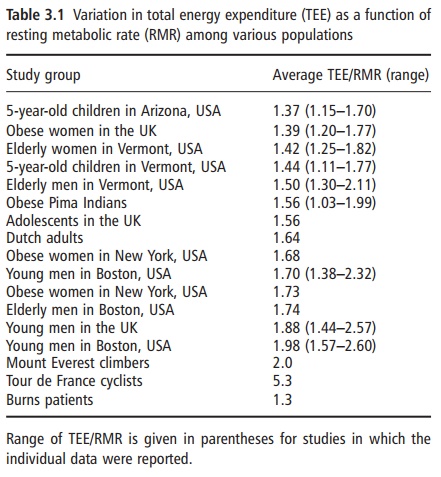
Although fat mass is generally thought to be meta-bolically inert, it significantly contributes to varia-tions in RMR. This is likely explained, at least in part, by neurobiological effects (e.g., changes in sympathetic nervous system activity) resulting from variations in fat mass which affect the metabolism of other tissues. RMR is also influenced by fat mass, even though fat mass is generally thought to be meta-bolically inert. Fat mass contributes in the order of 42.0–54.6 kJ/kg to RMR. This difference is indepen-dent of the gender difference in FFM; in other words, if one studied a group of males and females of identical FFM and similar age, RMR would be higher in males than in females by around 210.0 kJ/ day. This gender difference is consistent across the lifespan, and the source of the difference is not well understood (Table 3.1). More active people tend to have a higher RMR than inactive individuals. This difference may be explained in part by the resid-ual effects of chronic exercise on metabolic rate. In other words, RMR appears to be elevated because of the long-lasting effects of the thermic effect of exer-cise. However, other factors are also involved, since the higher RMR in more active individuals persists long after the last bout of exercise has been com-pleted. Collectively, FFM, fat mass, age, gender, and physical activity explain 80–90% of the variance in RMR. In addition, a portion of the unique variance in RMR across individuals has been ascribed to genetic factors, although the specific source of this genetic variation has not yet been identified. Other factors that have been shown to influence metabolic rate include thyroid hormones (higher levels increase metabolic rate) and sympathetic nervous system activity.
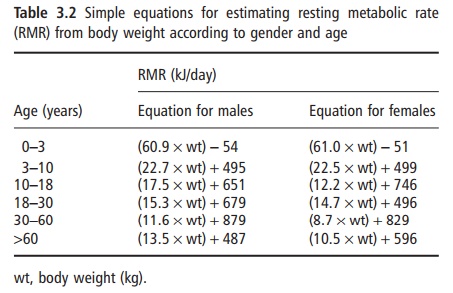
Several prediction equations have been developed to estimate RMR from other simple measures. These equations are often useful for making estimates in clinical situations when measurement of RMR cannot be achieved, or for estimating energy needs for other individuals. The classic equations of Harris and Benedict are frequently used for this purpose. These equations were developed from limited measures per-formed in the early 1900s, and predict RMR from age, height, and weight, and may be of limited accuracy. More recent equations have been developed in larger groups of subjects and can predict RMR from body weight (Table 3.2). These new equations have been shown to be more accurate.
Thermic effect of feeding
The thermic effect of meal ingestion is primarily influenced by the quantity and macronutrient quality of the ingested calories. The thermic effect of food has also been termed meal-induced thermogenesis, or the specific dynamic action of food. The increase in meta-bolic rate that occurs after meal ingestion occurs over an extended period of at least 5 hours; the cumulative energy cost is equivalent to around 10% of the energy ingested. In other words, if one consumed a mixed meal of 2.1 MJ, the body would require 210.0 kJ to digest, process, and metabolize the contents of the meal. The thermic effect of feeding is higher for protein and carbohydrate than for fat. This is because, for fat, the process of energy storage is very efficient, whereas, for carbohydrate and protein, additional energy is required for metabolic conversion to the appropriate storage form (i.e., excess glucose con-verted to glycogen for storage, and excess amino acids from protein converted to fat for storage). In addition to the obligatory energetic cost of processing and storage of nutrients, a more variable facultative ther-mogenic component has been described. This com-ponent is mainly pertinent to carbohydrates, which through increased insulin secretion produce a dipha-sic activation of the sympathoadrenal system. The initial phase is an insulin-mediated increase in sym-pathetic activity, which produces a β-adrenoceptor-mediated increase in energy expenditure. The second and later phase occurs when a counter-regulatory increase in plasma epinephrine is elicited by the falling blood glucose. This increase in epinephrine has a similar slight stimulatory effect on energy expenditure. As a result of the mediation by β-adrenoceptors the thermic effect of carbohydrate-rich meals can be slightly reduced by pharmacological β-adrenoceptor antagonists.
Energy expenditure related to physical activity
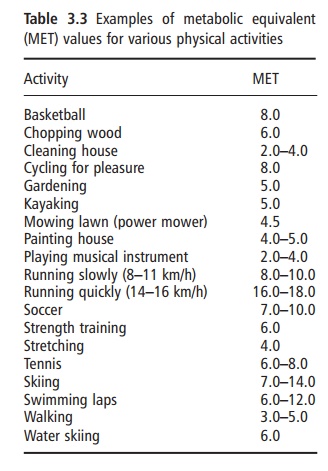
Physical activity energy expenditure encompasses all types of activity, including sports and leisure, work-related activities, general activities of daily living, and fidgeting. The metabolic rate of physical activity is determined by the amount or duration of activity (i.e., time), the type of physical activity (e.g., walking, running, typing), and the intensity at which the par-ticular activity is performed. The metabolic cost of physical activities is frequently expressed as metabolic equivalents (METs), which represent multiples of RMR. Thus, by definition, sitting quietly after a 12 hour fast is equivalent to 1 MET. Table 3.3 provides MET values for other typical physical activities. The cumulative total daily energy cost of physical activity is highly variable both within and between individuals. Therefore, physical activity provides the greatest source of plasticity or flexibility in the energy expenditure system, and is the component through which large changes in energy expenditure can be achieved.
Total energy expenditure: measurement by doubly labeled water
The integrated sum of all components of energy expenditure is termed total energy expenditure. Until recently, there was no good way to measure total energy expenditure in humans living under their habitual conditions. Total energy expenditure can be measured over 24 hours or longer in a metabolic chamber, but this environment is artificial and is not representative of the normal daily pattern of physical activity. The DLW technique can be used to obtain an integrated measure of all components of daily energy expenditure over extended periods, typically 7–14 days, while subjects are living in their usual environment. The technique was first introduced in the 1950s as an isotopic technique for measuring the carbon dioxide production rate in small animals. Unfortunately, it was not possible to apply the tech-nique to humans because the dose required was cost prohibitive given the relatively poor sensitivity of the required instrumentation at that time. It was not for another 20 years that the inventors of this technique described the feasibility of applying the technique to measure free-living energy expenditure in humans, and 10 years later this concept became a reality.
The DLW method requires a person to ingest small amounts of “heavy” water that is isotopically labeled with deuterium and oxygen-18 (2H2O and H218O). These forms of water are naturally occurring, stable (nonradioactive) isotopes of water that differ from the most abundant form of water. In deuterium-labeled water, the hydrogen is replaced with deute-rium, which is an identical form of water except that deuterium has an extra neutron in its nucleus com-pared with hydrogen, and is thus a heavier form of water; similarly, 18O-labeled water contains oxygen with an additional two extra neutrons. Thus, these stable isotopes act as molecular tags so that water can be tracked in the body. After a loading dose, deute-rium-labeled water is washed out of the body as a function of body water turnover; 18O is also lost as a function of water turnover, but is lost via carbon dioxide production as well. Therefore, using a number of assumptions, the rate of carbon dioxide produc-tion and energy expenditure can be assessed based on the different rates of loss of these isotopes from the body.
The major advantages of the DLW method are that the methodology is truly noninvasive and nonobtru-sive (subjects are entirely unaware that energy expen-diture is being measured), and measurement is performed under free-living conditions over extended periods (7–14 days). Moreover, when used in combi-nation with indirect calorimetry for assessment of resting metabolic rate, physical activity-related energy expenditure can be assessed by the difference (i.e., total energy expenditure minus resting metabolic rate, minus the thermic effect of meals = physical activity energy expenditure). The additional power of assessing total energy expenditure with the DLW method is that this approach can provide a measure of total energy intake in subjects who are in energy balance. This is because, by definition, in a state of energy balance, total energy intake must be equiva-lent to total energy expenditure. This aspect of the technique has been used as a tool to validate energy intakes using other methods such as food records and dietary recall. For example, it has been known for some time that obese subjects report a lower than expected value for energy intake. At one time it was thought that this was due to low energy requirements in the obese due to low energy expenditure and reduced physical activity. However, using DLW, it has now been established that obese subjects system-atically underreport their actual energy intake by 30– 40% and actually have a normal energy expenditure, relative to their larger body size.
The major disadvantages of the technique are the periodic nonavailability and expense of the 18O isotope (around €500–600 for a 70 kg adult), the need for and reliance on expensive equipment for analysis of samples, and that the technique is not well suited to large-scale epidemiological studies. Furthermore, although the technique can be used to obtain esti-mates of physical activity energy expenditure, it does not provide any information on physical activity pat-terns (i.e., type, duration, and intensity of physical activity periods during the day).
The DLW technique has been validated in humans in several laboratories around the world by compari-son with indirect calorimetry in adults and infants. These studies generally show the technique to be accurate to within 5–10%, relative to data derived by indirect calorimetry for subjects living in metabolic chambers. The theoretical precision of the DLW tech-nique is 3–5%. However, the experimental variability is ±12% under free-living conditions, owing to fluc-tuations in physical activity levels, and ±8% under more controlled sedentary living conditions. The good accuracy and reasonable precision of the tech-nique therefore allow the DLW method to be used as a “gold standard” measure of free-living energy expenditure in humans against which other methods can be compared.
Related Topics