Chapter: Biology of Disease: Disorders of the Cardiovascular System
Electrocardiogram (ECG) - Investigating Cardiac Function in Health and Disease
INVESTIGATING CARDIAC FUNCTION IN HEALTH AND DISEASE
Clinicians need to be able to diagnose cardiovascular problems and to monitor their treatment. Obviously, noninvasive methods are to be preferred as far as possible for the comfort of the patient.
THE ELECTROCARDIOGRAM (ECG)
The spread of depolarization and repolarization through the muscle mass of the heart is accompanied by measurable electrical potentials, which may be recorded through electrodes placed on the skin. The record of these potentials is called an electrocardiogram (ECG) and represents the aggregate or resultant electrical activity associated with the action potentials of millions of individual cells, each of which has an amplitude and direction. Recording a patient’s ECG is a way of investigating the electrical activity of the heart and when the pattern is abnormal it is invaluable in diagnosing a variety of heart complaints. The test is quick, simple and painless, and provides information on the heart rhythm and underlying cardiac morphology.
An ECG is recorded by placing electrodes, these days usually disposable, self-adhesive ones, on the chest and limbs. In practice the ECG is recorded simultaneously from six electrodes connected to the limbs and six to the chest that measure the direction and flow of electric currents during each heartbeat. The results are recorded (Figure 14.11 (A)), with each trace representing a particular ‘view’ of the heart’s electrical activity; these views are referred to as leads. The spikes and troughs on the graph correspond to specific events in the cycle of a heartbeat and these are lettered alphabetically (Figure 14.11 (B)). Modern ECG instruments have a built-in computer that analyzes therecordings and produces a printout of the analysis.

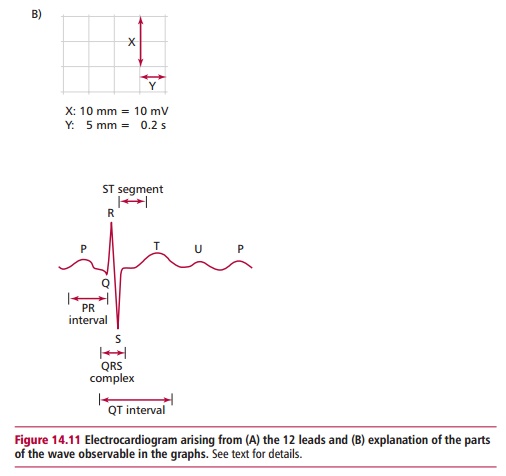
In the normal ECG waveform, the first deflection is caused by atrial depolarization and is a low-amplitude slow deflection called a P wave. The following QRS complex results from ventricular depolarization, and as can be seen in Figure 14.11 (B), it is sharper and larger in amplitude than the P wave. The T wave is another slow, low-amplitude wave resulting from ventricular repolarization. Atrial repolarization is not usually seen because it is low voltage and is hidden by the QRS complex. The PR interval is the time from the start of the P wave to the start of the QRS complex and represents the time taken for activation to pass from the SA node, through the atrium to the AV node. The QRS complex is a measure of the time associated with impulses passing through the His-Purkinje system and the subsequent contractions of the ventricles. The QT interval begins at the start of the QRS complex and finishes at the end of the T wave and this represents the time taken to depolarize and repolarize the ventricular myocardium. The ST segment is the time between the end of the QRS complex and the start of the T wave. At this point all the cells of the normal heart are depolarized.
The print out from an ECG examination can help the cardiologist to identify a number of heart problems including abnormal rhythms, inadequate blood supply to the heart and excessive thickening of the heart muscle (hypertrophy). For example, a heightened P wave indicates an enlarged atrium; a deeper than normal Q wave may indicate a myocardial infarction and a heightened R wave usually indicates a thickening of the ventricular wall. If the ST segment is raised above the horizontal it may indicate acute myocardial infarction or, if it is below the horizontal, it can imply high blood K+ concentrations or cardiac ischemia. Any deviation from the normal rate or sequence of the ECG is referred to as a cardiac arrhythmia. If the sinoatrial (SA) node is damaged the heart rate may slow to 40–50 beats per min and if damage occurs to both the SA and AV nodes it may fall to 20–40 beats per min and the patient will require a pacemaker.
In addition to the basic technique, the cardiac response may be recorded during exercise as the patient walks or runs on a treadmill and this can give further clinical information. In other situations, the ECG may be recorded over 24 h using a portable ECG machine to monitor intermittent arrhythmias.
Related Topics