Chapter: Multicore Application Programming For Windows, Linux, and Oracle Solaris : Coding for Performance
Commonly Available Profiling Tools
Commonly
Available Profiling Tools
Most
modern profiling tools do not require you to do anything special to the
application. However, it is often beneficial to build the application with
debug information. The debug information can enable the tools to aggregate
runtime at the level of individual lines of source code. There are also two
common approaches to profiling.
The first
approach is system-wide profiling. This is the approach taken by tools such as
Intel’s VTune, AMD’s CodeAnalyst, and the open source profiling tool oprofile. The
entire system is inspected, and timing information is gathered for all the
processes run-ning on the system. This is a very useful approach when there are
a number of coordi-nating applications running on the system. During the
analysis of the data, it is normal to focus on a single application.
Figure
2.9 shows the output from the AMD CodeAnalyst listing all the active processes
on the system.
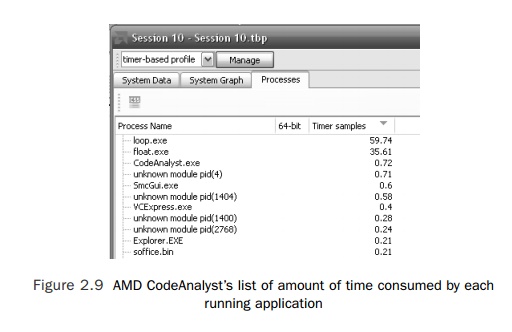
In this
instance, there are two applications using up almost all of the CPU resources
between them.
The
second common approach is to profile just the application of interest. This
approach is exemplified by the Solaris Studio Performance Analyzer. Profiling a
single application enables the user to focus entirely on that application and
not be distracted by the other activity on the system.
Regardless
of the tool used, there are a common set of necessary and useful features. The most
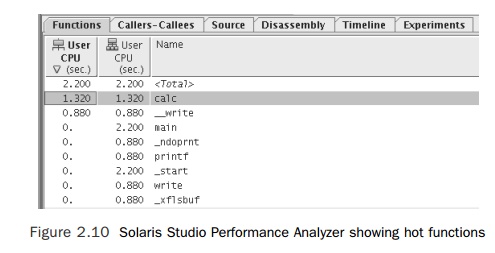
critical feature is probably the profile of the time spent in each function.
Figure 2.10 shows the time spent in each function as reported by the Solaris
Studio Performance Analyzer.
The
profile for this code shows that about 70% of the user time is spent in the
rou-tine calc() with the
remainder spent in the routine __write().
Profile
data at the function level can be useful for confirming that time is being
spent in the expected routines. However, more detail is usually necessary in
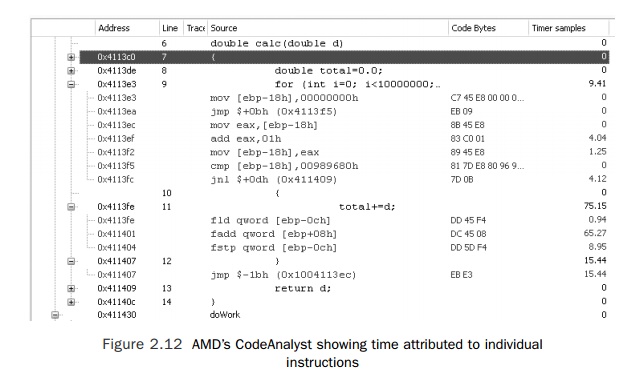
order to improve the application. Figure 2.11 shows time attributed to lines of
source in the AMD CodeAnalyzer.
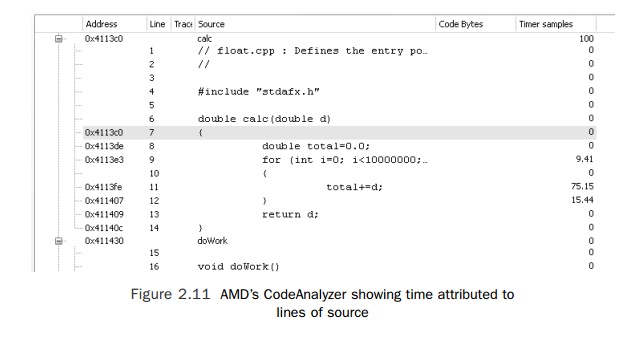
Using the
source-level profile, most developers can make decisions about how to
restructure their code to improve performance. It can also be reassuring to
drop down into assembly code level to examine the quality of the code produced
by the compiler and to identify the particular operations that are taking up
the time. At the assembly code level, it is possible to identify problems such
as pointer aliasing producing subopti-mal code, memory operations taking
excessive amounts of time, or other instructions that are contributing
significant time. Figure 2.12 shows the disassembly view from the AMD
CodeAnalyst.
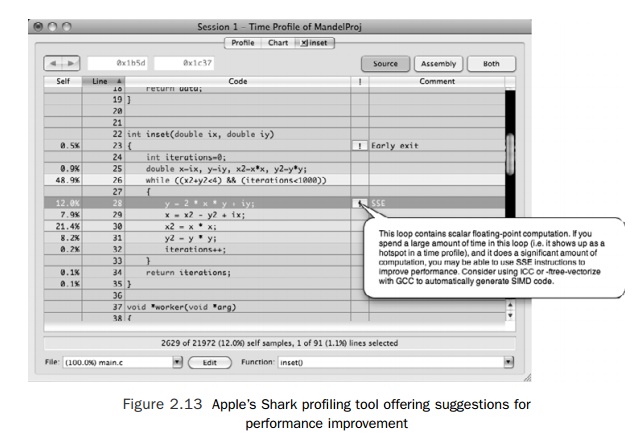
Some
tools are able to provide suggestions on how to improve the performance of the
application. Figure 2.13 shows output from Apple’s Shark tool, which suggests
improving performance by recompiling the application to use SSE instructions.
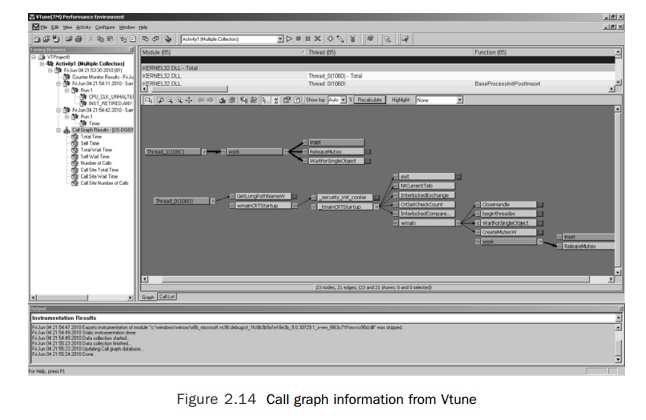
Many
performance problems can be analyzed and solved at the level of lines of source
code. However, in some instances, the problem is related to how the routine is
used. In this situation, it becomes important to see the call stack for a
routine. Figure 2.14 shows a call chart from Intel’s Vtune tool. The figure
shows two threads in the application and indicates the caller-callee
relationship between the functions called by the two threads.
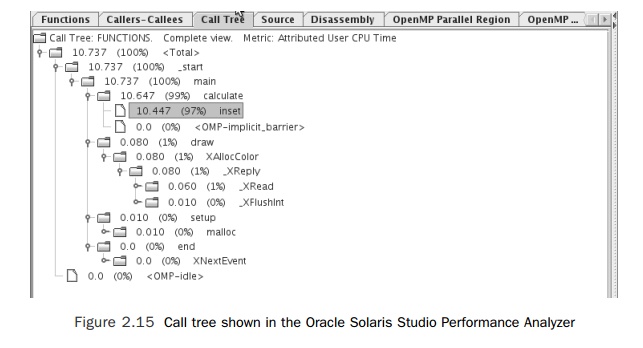
An
alternative way of presenting caller-callee data is from the Oracle Solaris
Studio Performance Analyzer, as shown in Figure 2.15. This hierarchical view
allows the user to drill down into the hottest regions of code.
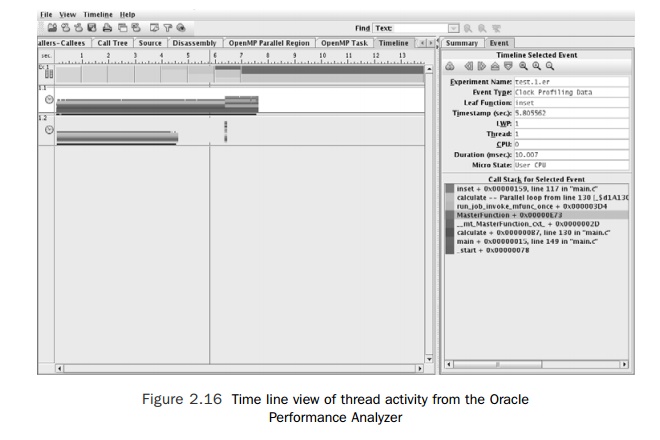
Another
view of the data that can be particularly useful is the time line view. This
shows program activity over time. Figure 2.16 shows the time live view from the
Solaris Studio Performance Analyzer. In this case, the time line view shows
both thread activity, which corresponds to the shaded region of the horizontal
bars, together with call stack information, indicated by the different colors
used to shade the bars. Examining the run of an application over time can
highlight issues when the behavior of an application changes during the run. An
example of this might be an application that develops a great demand for memory
at some point in its execution and consequently spends a period of its runtime
exclusively in memory allocation code.
A similar
view is available from Apple’s Instruments tool, as shown in Figure 2.17. An instrument is the name given to a tool
that gathers data about processor, disk, network, and memory usage over the run of an application. This particular
example shows proces-sor utilization by the two threads over the run of the
application. The time line view is particularly useful for multithreaded
applications. To get the best performance, the work needs to be evenly divided
between all threads. The time line view is a quick way of telling whether some
threads are more active than others. It can also be useful for codes where a
synchronization event, such as garbage collection in the case of Java, causes
most of the threads in an application to pause.
Performance
analysis tools are critical in producing optimal serial and parallel codes.
Consequently, it is important to become familiar with the tools available on
your system. For serial codes, a performance analysis tool will identify the
region of code that needs to be improved to increase the performance of an
application. For parallel codes, they will allow you to identify regions of
code where the parallelization could be improved or where the work could be
better distributed across the available processors or threads.
Related Topics