Chapter: Computer Programming
Algorithm, Pseudocode and Flowchart
ALGORITHM
Algorithm
·
Set of step-by-step instructions that perform a
specific task or operation
·
―Natural‖ language NOT programming language
Pseudocode
·
Set of instructions that mimic programming language
instructions
Flowchart
·
Visual program design tool
·
―Semantic‖ symbols describe operations to be
performed
FLOWCHARTS
Definitions:
A
flowchart is a schematic representation of an algorithm or a stepwise process,
showing the steps as boxes of various kinds, and their order by connecting
these with arrows. Flowcharts are used in designing or documenting a process or
program.
A flow
chart, or flow diagram, is a graphical representation of a process or system
that details the sequencing of steps required to create output.
A
flowchart is a picture of the separate steps of a process in sequential order.
TYPES:
High-Level Flowchart
A
high-level (also called first-level or top-down) flowchart shows the major
steps in a process. It illustrates a "birds-eye view" of a process,
such as the example in the figure entitled High-Level Flowchart of Prenatal
Care. It can also include the intermediate outputs of each step (the product or
service produced), and the sub-steps involved. Such a flowchart offers a basic
picture of the process and identifies the changes taking place within the
process. It is significantly useful for identifying appropriate team members (those
who are involved in the process) and for developing indicators for monitoring
the process because of its focus on intermediate outputs.
Most
processes can be adequately portrayed in four or five boxes that represent the
major steps or activities of the process. In fact, it is a good idea to use
only a few boxes, because doing so forces one to consider the most important
steps. Other steps are usually sub-steps of the more important ones.
Detailed Flowchart
The
detailed flowchart provides a detailed picture of a process by mapping all of
the steps and activities that occur in the process. This type of flowchart
indicates the steps or activities of a process and includes such things as
decision points, waiting periods, tasks that frequently must be redone
(rework), and feedback loops. This type of flowchart is useful for examining
areas of the process in detail and for looking for problems or areas of
inefficiency. For example, the Detailed Flowchart of Patient Registration
reveals the delays that result when the record clerk and clinical officer are
not available to assist clients.
Deployment or Matrix Flowchart
A
deployment flowchart maps out the process in terms of who is doing the steps.
It is in the form of a matrix, showing the various participants and the flow of
steps among these participants. It is chiefly useful in identifying who is
providing inputs or services to whom, as well as areas where different people
may be needlessly doing the same task. See the Deployment of Matrix Flowchart.
ADVANTAGES OF USING FLOWCHARTS
The
benefits of flowcharts are as follows:
1. Communication: Flowcharts are better way of
communicating the logic of a system to all
concerned.
2. Effective analysis: With
the help of flowchart, problem can be analysed in more effective way.
Proper documentation: Program
flowcharts serve as a good program documentation, which is needed for various purposes.
4. Efficient Coding: The flowcharts act as a guide
or blueprint during the systems analysis and program development phase.
5. Proper Debugging: The flowchart helps in
debugging process.
6. Efficient Program Maintenance: The
maintenance of operating program becomes easy with the help of flowchart. It helps the programmer to put efforts more
efficiently on that part
Advantages:
·
Logic Flowcharts are easy to understand.They
provide a graphical representation of actions to be taken.
·
Logic Flowcharts are well suited for representing
logic where there is intermingling among many actions.
Disadvantages:
·
Logic Flowcharts may encourage the use of GoTo
statements leadingsoftware design that is unstructured with logic that is
difficult to decipher.
·
Without an automated tool, it is time-consuming to
maintain Logic Flowcharts.
·
Logic Flowcharts may be used during detailed logic
design to specify a module.
·
However, the presence of decision boxes may
encourage the use of GoTo statements, resulting in software that is not
structured. For this reason, Logic Flowcharts may be better used during
Structural Design
LIMITATIONS OF USING FLOWCHARTS
1. Complex logic: Sometimes, the program logic is
quite complicated. In that case, flowchart
becomes complex and clumsy.
2. Alterations and Modifications: If
alterations are required the flowchart may require re-drawing completely.
3. Reproduction: As the flowchart symbols cannot
be typed, reproduction of flowchart becomes a problem.
4. The
essentials of what is done can easily be lost in the technical details of how
it is done.
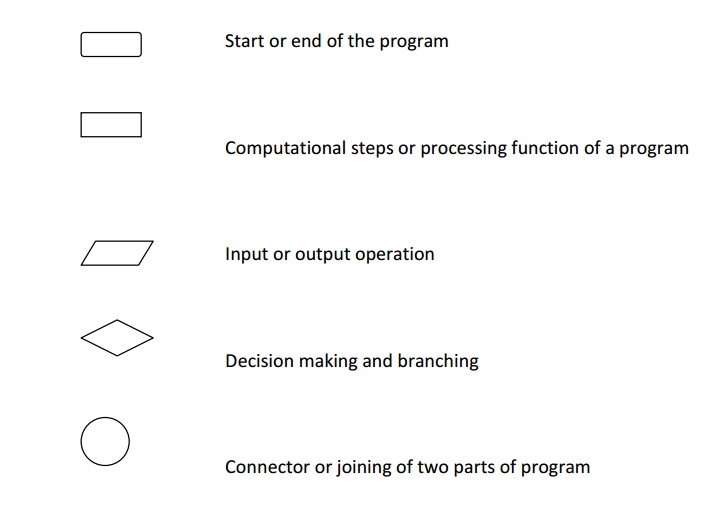
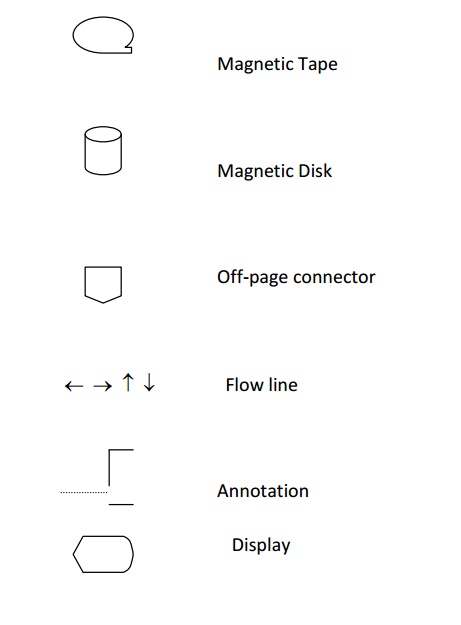
GUIDELINES FOR DRAWING A
FLOWCHART
Flowcharts
are usually drawn using some standard symbols; however, some special symbols
can also be developed when required. Some standard symbols, which are
frequently required for flowcharting
many computer programs.
The following are some guidelines in flowcharting:
(a)
In drawing a proper flowchart, all necessary
requirements should be listed out in logical order.
(b)
The flowchart should be clear, neat and easy to
follow. There should not be any room for ambiguity in understanding the
flowchart.
(c)
The usual direction of the flow of a procedure or
system is from left to right or top to bottom.
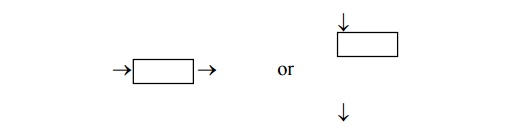
(d)
Only one flow line should come out from a process
symbol.
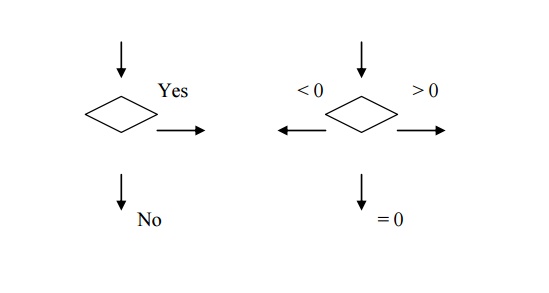
(e)
Only one flow line should enter a decision symbol,
but two or three flow lines, one for each possible answer, should leave the
decision symbol.
(f)
Only one flow line is used in conjunction with
terminal symbol.
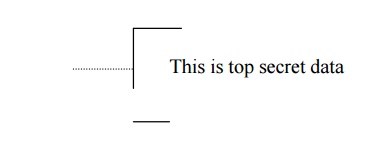
(g)
Write within standard symbols briefly. As
necessary, you can use the annotation symbol to describe data or computational
steps more clearly.
(h)
If the flowchart becomes complex, it is better to
use connector symbols to reduce the number of flow lines. Avoid the
intersection of flow lines if you want to make it more effective and better way
of communication.
(i)
Ensure that the flowchart has a logical start and finish.
(j) It is useful to test the validity of the flowchart by passing through it with a simple test data.
Examples
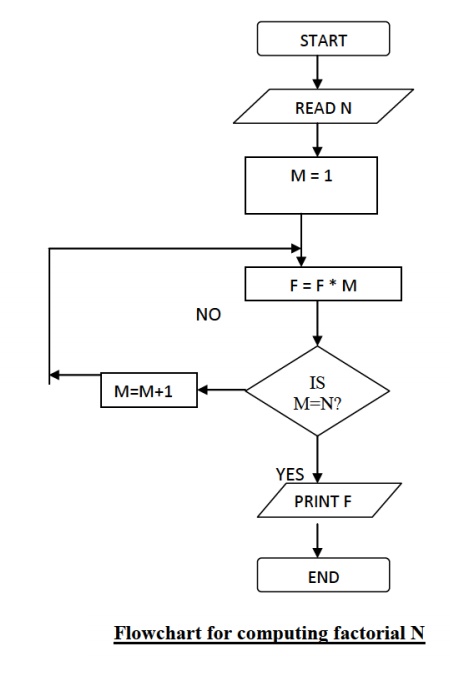
Sample flowchart
A
flowchart for computing factorial N (N!) Where N! = 1 * 2 * 3 *...* N. This
flowchart represents a "loop and a half" — a situation discussed in
introductory programming textbooks that requires either a duplication of a
component (to be both inside and outside the loop) or the component to be put
inside a branch in the loop
Sample Pseudocode
ALGORITHM
Sample
GET Data
WHILE
There Is Data
DO Math
Operation
GET Data
END WHILE
END
ALGORITHM
Related Topics