Chapter: Multicore Application Programming For Windows, Linux, and Oracle Solaris : Synchronization and Data Sharing
Using Tools to Detect Data Races
Using
Tools to Detect Data Races
The code shown in Listing 4.3 contains a data race. The code uses POSIX
threads, which will be introduced in Chapter 5, “Using POSIX Threads.” The code
creates two threads, both of which execute the routine func(). The main thread then waits for both the child threads to complete
their work.
Listing 4.3 Code
Containing Data Race
#include
<pthread.h>
int
counter = 0;
void
* func(void * params)
{
counter++;
}
void
main()
{
pthread_t thread1, thread2; pthread_create( &thread1, 0, func, 0);
pthread_create( &thread2, 0, func, 0); pthread_join( thread1, 0 );
pthread_join( thread2, 0 );
}
Both
threads will attempt to increment the variable counter. We can compile this code with
GNU gcc and then use Helgrind, which is part of the Valgrind suite, to identify
the data race. Valgrind is a tool that enables an application to be
instrumented and its runtime behavior examined. The Helgrind tool uses this
instrumentation to gather data about data races. Listing 4.4 shows the output
from Helgrind.
Listing 4.4 Using
Helgrind to Detect Data Races
$
gcc -g race.c -lpthread
$
valgrind -–tool=helgrind ./a.out
...
==4742==
==4742==
Possible data race during write of size 4 at
0x804a020 by thread #3
==4742== at 0x8048482:
func (race.c:7)
==4742== by 0x402A89B:
mythread_wrapper (hg_intercepts.c:194)
==4742== by 0x40414FE:
start_thread (in /lib/tls/i686/cmov/libpthread-2.9.so)
==4742== by 0x413849D:
clone (in /lib/tls/i686/cmov/libc-2.9.so)
==4742== This conflicts
with a previous write of size 4 by thread #2
==4742== at 0x8048482:
func (race.c:7)
==4742== by 0x402A89B:
mythread_wrapper (hg_intercepts.c:194)
==4742== by 0x40414FE:
start_thread (in /lib/tls/i686/cmov/libpthread-2.9.so)
==4742== by 0x413849D:
clone (in /lib/tls/i686/cmov/libc-2.9.so)
The output from Helgrind shows that there is a potential data race
between two threads, both executing line 7 in the file race.c. This is the anticipated result, but it should be pointed out that the
tools will find some false positives. The programmer may write code where
different threads access the same variable, but the programmer may know that
there is an enforced order that stops an actual data race. The tools, however,
may not be able to detect the enforced order and will report the potential data
race.
Another tool that is able to detect potential data races is the Thread
Analyzer in Oracle Solaris Studio. This tool requires an instrumented build of
the application, data collection is done by the collect tool, and the graphical interface is launched with the command tha. Listing 4.5 shows the steps to do this.
Listing 4.5 Detecting
Data Races Using the Sun Studio Thread Analyzer
$ cc -g -xinstrument=datarace
race.c
$ collect -r on ./a.out
Recording experiment tha.1.er ...
$ tha tha.1.er&
1.
http: // valgrind.org/

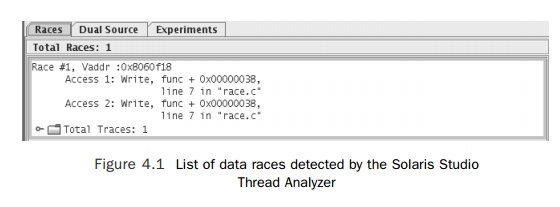
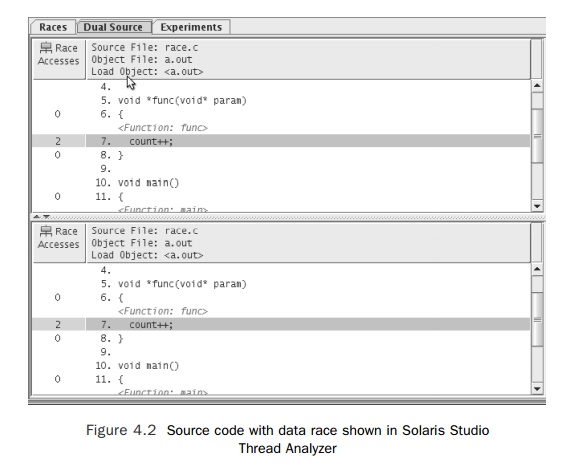
The initial screen of the tool displays a list of data races, as shown in Figure 4.1. Once the user has identified the data race they are interested in, they can view the source code for the two locations in the code where the problem occurs. In the exam-ple, shown in Figure 4.2, both threads are executing the same source line.

Related Topics