Chapter: Operations Research: An Introduction : Transportation Model and Its Variants
Transshipment Model
THE TRANSSHIPMENT MODEL
The transshipment model recognizes that it may be cheaper to ship
through intermediate or transient
nodes before reaching the final destination. This concept is more gen-eral than
that of the regular transportation model, where direct shipments only are
allowed between a source and a destination.
This section shows how a transshipment model can be converted to (and
solved as) a regular transportation model using the idea of a buffer.
Example 5.5-1
Two automobile plants, p1
and p2, are linked to
three dealers, DI, D2, and D3, by way of two transit centers, T1
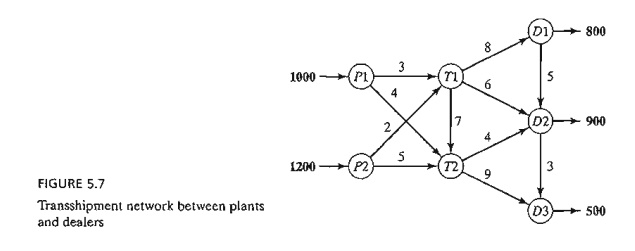
and T2, according to the network shown in Figure 5.7. The supply amounts at
plants PI and P2 are 1000 and 1200 cars, and the demand amounts at dealers Dl, D2, and D3, are 800, 900, and 500 cars. TIle shipping costs per car (in
hundreds of dollars) between pairs of nodes are shown on the connecting links
(or arcs) of the network.
Transshipment occurs in the network in Figure 5.7 because the entire
supply amount of 2200 (= 1000 + 1200) cars at nodes P1 and P2 could conceivably pass through
any node of the
network before ultimately reaching their destinations at nodes D1, D2, and D3. In this regard, each node of the
network with both input and output arcs (T1., T2, D1, and D2) acts as both a source and a
destination and is referred to as a transshipment node. The remaining nodes are
either pure supply nodes (P1 and P2) or pure demand nodes (D3).
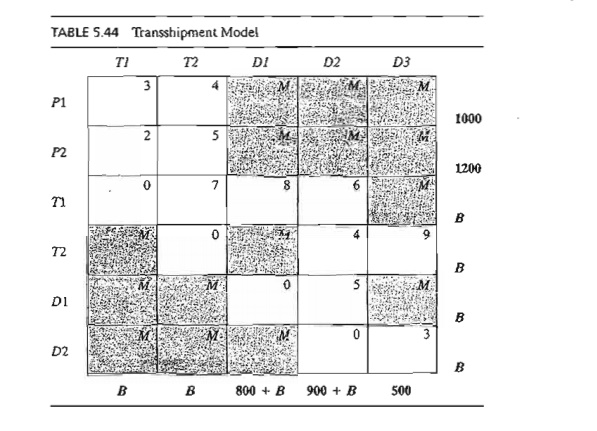
The transshipment model can be converted into a regular transportation
model with six sources (P1, P2, T1., T2, Dl, and D2) and five destinations (T1,T2, D1, D2, and
D3).1l1e amounts of supply and demand at the different nodes are computed as
Supply at a pure supply node = Original supply
Demand at a pure demand node = Original demand
Supply at a transshipment node
= Original supply + Buffer amount
Demand at a transshipment node
= Original demand + Buffer amount
The buffer amount should be sufficiently large to allow all of the original supply (or demand) units to
pass through any of the transshipment
nodes. Let B be the desired buffer
amount; then
B = Total supply (or demand)
= 1000 + 1200 (or 800 + 900 + 500)
= 2200 cars
Using the buffer B and the unit shipping costs given in the network; we construct the
equivalent regular transportation model as in Table 5.44.
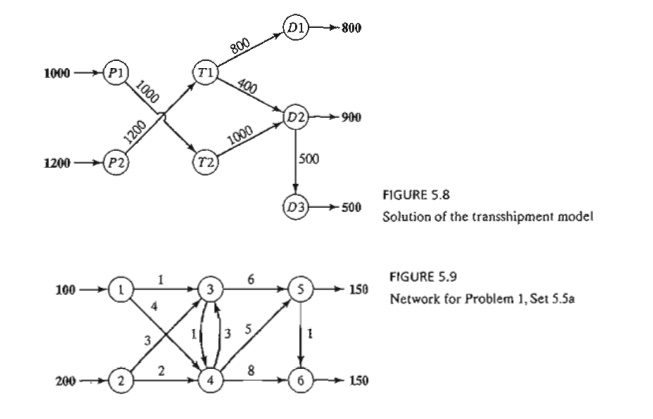
The solution of the resulting transportation model (determined by TORA)
is shown in Figure 5.8. Note the effect of transshipment: Dealer D2 receives
1400 cars,
keeps 900 cars to
sat-isfy its demand, and sends the remaining 500 cars to dealer D3.
PROBLEM SET 5.5A
1. The network in Figure 5.9 gives the shipping routes from nodes 1 and
2 to nodes 5 and 6 by way of nodes 3 and 4. The unit shipping costs are shown
on the respective arcs.
a.Develop the corresponding
transshipment model.
b.Solve the problem, and show how
the shipments are routed from the sources to the destinations.
2. In Problem 1, suppose that source node 1 can be linked to source node
2 with a unit ship-ping cost of $1. The unit shipping cost from node 1 to node
3 is increased to $5. Formulate the problem as a transshipment model, and find
the optimum shipping schedule.
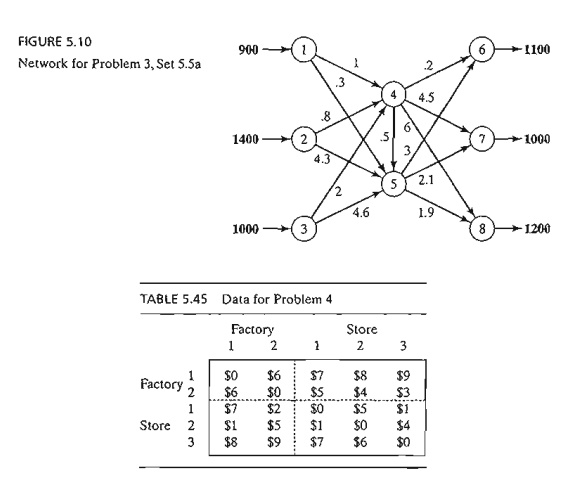
3. The network in Figure 5.10 shows the routes for shipping cars from
three plants nodes 1, 2, and 3) to three dealers (nodes 6 to 8) by way of two
distribution centers (nodes 4 and 5). The shipping costs per car (in $100) are
shown on the arcs.
a. Solve the problem as a
transshipment model.
b. Find the new optimum solution
assuming that distribution center 4 can sell 240 cars directly to customers.
*4. Consider the transportation problem in which two factories supply
three stores with a commodity. The numbers of supply units available at sources
1 and 2 are 200 and 300; those demanded at stores 1,2, and 3 are 100,200, and
50, respectively. Units may be trans-shipped among the factories and the stores
before reaching their final destination. Find the optimal shipping schedule
based on the unit costs in Table 5.45.
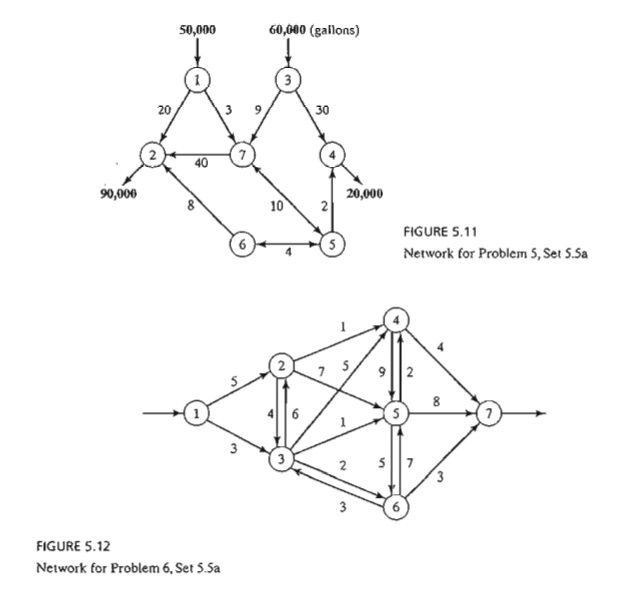
5. Consider
the oil pipeline network shown in Figure 5.11. The different nodes represent pumping
and receiving stations. Distances in miles between the stations are shown on
the network. The transportation cost per gallon between two nodes is directly
proportional to the length of the pipeline. Develop the associated
transshipment model, and find the op-timum solution.
6. Shortest-Route Problem. Find the
shortest route between nodes 1 and 7 of the network in Figure 5.12 by formulating the problem as a transshipment model.
The distances between the different nodes are shown on the network. (Hint: Assume that node 1 has a net
sup-ply of 1 unit, and node 7 has a net demand also of 1 unit.)
7. In the
transshipment model of Example 5.5-1, define Xij as the amount shipped from node i to node j. The problem can be
formulated as a linear program in which each node produces a constraint
equation. Develop the linear program, and show that the resulting formulation
has the characteristic that the constraint coefficients, aij, of the
variable xij are

8. An employment agency must provide the
following laborers over the next 5 months:

Because
the cost of labor depends on the length of employment, it may be more
economical to keep more laborers than needed during some months of the 5-month
planning horizon. The following table estimates the labor cost as a function of
the length of employment:

Formulate
the problem as a linear program. Then, using proper algebraic manipulations of
the constraint equations, show that the model can be converted to a transshipment
model, and find the optimum solution. (Hint:
Use the transshipment characteristic in Problem 7 to convert the constraints of
the scheduling problem into those of the trans-shipment model.)
Related Topics