Weather Maps | Geography - Tracking of Cyclones | 11th Geography : Chapter 12 : Weather Maps
Chapter: 11th Geography : Chapter 12 : Weather Maps
Tracking of Cyclones
Tracking of Cyclones
Tropical cyclone forecasting involves the prediction of several interrelated features, including the track of the cyclone, its intensity, resulting rainfall and storm surge and the areas threatened. Cyclone tracking is a constantly evolving science.
Different methods are used, including using satellites, radars, etc. A skilled meteorologist has often developed an ability to detect overall patterns in climatological conditions and can assess how these may affect cyclone development. Manual forecasts made by skilled
At present, the cyclones are tracked with the help of satellite images. The satellite images are collected and put into motion for several hours, and with the gathered information, the development of a tropical cyclone is tracked. Doppler radars detect rain associated with cyclones, which locate and estimate the amount of rainfall and depicts a hurricane’s rainfall.
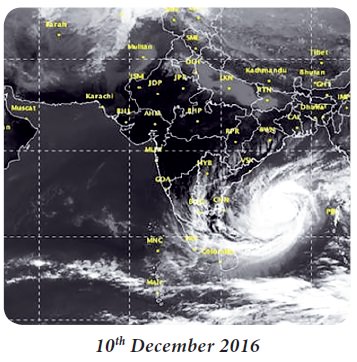
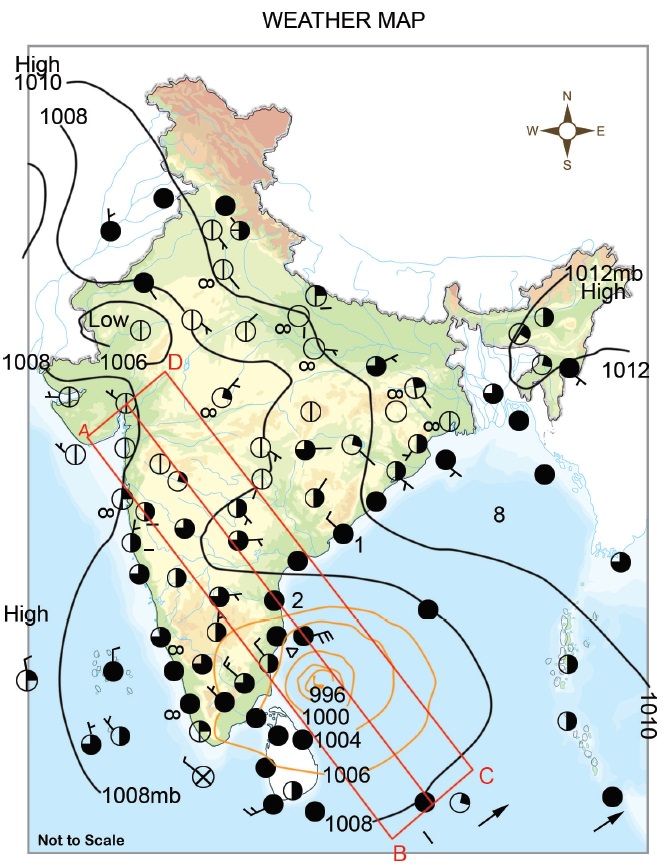
In the satellite based techniques, track and intensity of cyclone are forecast based on the cloud pattern associated with the cyclone. Generally the outer cloud bands of cumulonimbus clouds indicate the future direction, and the cloud pattern surrounding eye of the cyclone indicates the future intensity of the cyclone. Below is an example of tracking Vardah Cyclone by using satellite images.
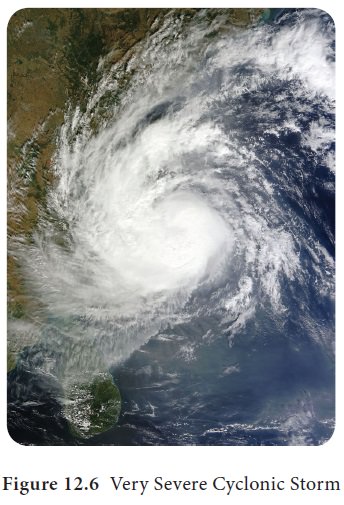
Cyclone Tracking based on Satellite Images – Vardah (Example)
Very Severe Cyclonic Storm, Vardah, was the fourth cyclonic storm, as well as the most intense tropical cyclone of the 2016 North Indian Ocean. The system struck the Andaman and Nicobar Islands, as well as South India. Originating as a low pressure area near the Malay Peninsula on December 3, the storm was designated as a depression on December 6. It gradually intensified into a Deep Depression on the following day, skirting off the Andaman and Nicobar Islands, and intensified into a Cyclonic Storm on December 8. Maintaining a generally westward track thereafter, Vardah consolidated into a Severe Cyclonic Storm on December 9, before peaking as a Very Severe Cyclonic Storm, with winds of 130 km/h, and a minimum central pressure of 982 mb on December 11. Weakening into a Severe Cyclonic Storm, Vardah, made landfall close to Chennai on the following day, and degenerated into a remnant low on December 13.The name Vardah, suggested by Pakistan, refers to the red rose.
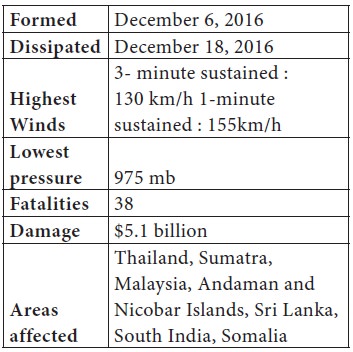
Satellite Images
Cyclone Tracking - Vardah
Under the influence of a persistent area of convection, a low pressure area was formed in the Malay Peninsula and adjoining north Sumatra, in early December 2016. The low pressure area emerged as a tropical disturbance over the next several days, as it slowly moved towards the southeast Bay of Bengal. On December 6, The IMD classified the system as a Depression in the BOB 06, as it had sufficiently organized itself, with winds of 45 km/h. Owing to low wind shear and favourable sea surface temperatures, the depression gradually intensified into a Deep Depression on the following day. Skirting off the Andaman and Nicobar Islands as a Deep Depression, the BOB 06 was upgraded to a Cyclonic Storm by the IMD and JTWC, in the early hours of December 8, and was assigned the name Vardah. The name of severe cyclonic storm ‘Vardah’, which has made landfall, hitting the coast 60 km from Chennai, has been given by Pakistan.
‘Vardah’ means ‘red rose’. The name of cyclones in the Indian Ocean Region is decided by member countries -- India, Sri Lanka, Bangladesh, Thailand, Myanmar, Maldives and Oman.
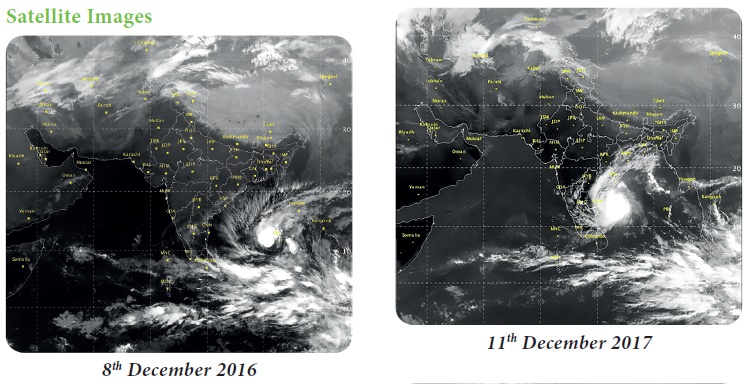
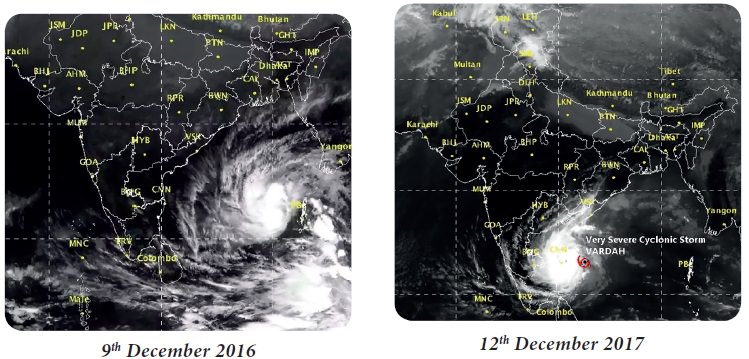
With conditions favourable for further development, Vardah intensified into a Severe Cyclonic Storm on December
Although predicted to maintain its intensity, Vardah strengthened further, as it followed a general west-northwestwards track, prompting the IMD to upgrade its intensity to a Very Severe Cyclonic Storm status, on December 10. Gradually intensifying as it moved westwards, Vardah reached its peak intensity on December 11, with maximum sustained winds of km/h, the wind gusts reached to 193 km/h, according to IMD with a minimum central pressure of 982 mb.
On December 12, Vardah weakened into a Severe Cyclonic Storm, before making landfall over the eastern coast of India, close to Chennai, with winds of 105 km/h. Afterward, it rapidly weakened into a depression, due to land interaction, on 13 December. The depression caused overnight rainfall in southern Karnataka on December 13. Due to frictional forces, the system degenerated into a well-marked low pressure area around midday on December 13, and moved out of Karnataka and into the Arabian Sea, as a low pressure area in the evening.
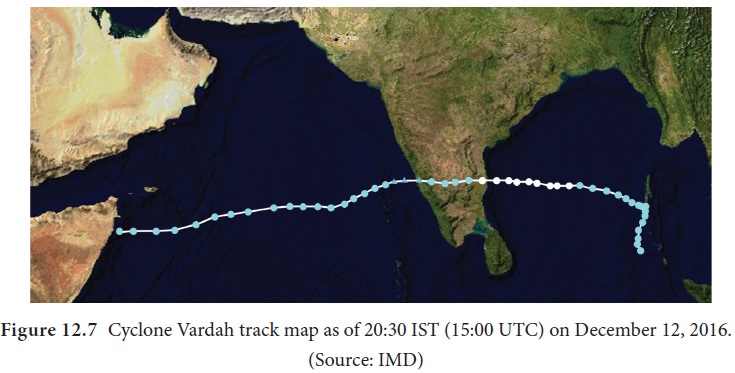
Reporting Cyclone Vardah based on a cyclone tracking map of December 12, 2016
Very Severe Cyclone Vardah made landfall near the Indian city of Chennai, the capital of Tamil Nadu state, on Monday, December 12, 2016, between 15:00 and 17:00 IST (9:30-11:30 UTC). With wind speeds as high as 100-110 km/h (62-68 mph) reported, and drenching rain, Vardah has caused wind damage to lightly built structures and some localized flooding as it moved across the northern part of Tamil Nadu. The National Disaster Management Authority reported four deaths from the cyclone.
Cyclone Vardah—which originated as a tropical disturbance on December 6— is the only storm to have attained very severe cyclonic storm status in the Bay of Bengal this year. While still a depression over the Bay of Bengal, Vardah brought heavy rainfall to the Andaman Islands, from which 2,300 tourists were evacuated.
Damage and Disruption
The India Meteorological Department (IMD) issued a heavy rainfall warning and a wind warning prior to landfall, and reportedly tens of thousands of people were evacuated, including many from low-lying areas.
The IMD projected wind speeds of 70-80 km/h (43-50 mph), with gusts to 90 km/h (56 mph) for the first few hours after landfall, with some damage to power and communications lines due to uprooted trees and broken branches, and roof damage to thatched huts. Heavy rainfall was expected throughout the region, with heavy to very heavy precipitation in southern coastal Andhra Pradesh, Rayalaseema, northern Tamil Nadu, and Puducherry, according to the IMD. Fishermen were advised not to go to sea while the sea remained high, although conditions should moderate by Tuesday morning.
Forecast Track and Intensity
The IMD forecast Cyclone Vardah to move nearly westward across Tamil Nadu, weakening by Tuesday, December 13, to a depression, with maximum sustained surface wind speeds of 35-45 km/h (22-28 mph) and gusts to 55 km/h (34).
At present, the automated weather stations are connected through the VSAT and connected to NRSC server. Weather forecasting is now undertaken with the help of satellite data.
The satellites provide information about the present weather condition and continuously update weather parameters from time to time.
Exercises
I. Answer the following
1) Which are the instruments used to measure weather elements?
2) In what way are weather satellites significant in weather forecasting?
3) Give the weather symbols for the following.
a) Hail
b) Gentle breeze
c) Rain
d) Calm
e) Obscured
4) What is weather nowcasting?
5) Find the wind direction and velocity from the following wind barbs.

6. Name the weather elements in the given Station Model.
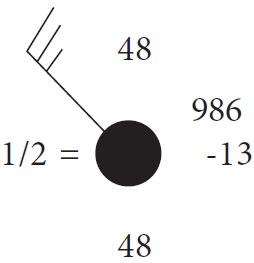
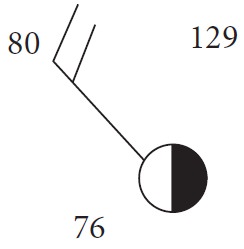
7. Write an interpretation for the following station model.
8. Prepare a station model with the following weather parameters.
a. Dry Bulb temperature - 220 C
b. Dew point -180C
c. Barometric Pressure reduced to mean sea level standard gravity is 998mb
d. Total cloud amount -5 oktas
9. Prepare a small project of the Okchi cyclone with the help of the Satellite Images.
Practice
A. Make an Anemometer
Materials
• 4 small paper cups
• 4 plastic drinking straws
• Tape
• Scissors
• Straight pin
• Pencil with a new eraser
• Stapler
Procedure
• This anemometer has four cups which catch the wind and cause the anemometer to spin. The inward curve of the cups receives most of the force of the wind. That’s what makes the cups move. The more spins per minute, the greater the wind velocity.
• Arrange four (4) plastic drinking straws to form a cross and tape them together at the centre.
• Staple the top side of one drinking cup, such as the small paper cups designed for bathroom dispensers, at the end of each straw, so the open ends of the cups all face the same direction.
• Push a straight pin through the centre of the straws into an eraser on the end of a pencil. This provides the axle.
• Mark one of the cups; this will be the one they use for counting when the anemometer spins.
• Blow on the anemometer or turn an electric fan on low to make sure that it spins easily. How many times the anemometer will spin in one minute? Can you make a statement connecting the number of spins of your anemometer and the speed of the wind? (You can use the table below to record your practice trials).
B. Use an Anemometer to measure Wind Speed
Materials
Anemometer
• Divide the students into small groups with the following roles (optional)
o One time keeper who will be responsible for timing one minute for each trial.
o One official “counter” for the day. The others may count on their own, but the counter’s readings will be the ones recorded.
o One person who will hold the anemometer while the spins are counted; the person holding should make sure that he holds the anemometer so that the wind is unobstructed.
• Mount or hold the anemometer in a place that has full access to the wind from all directions.
• When the timekeeper says “Go”, the counter in each group will count how many times the marked cup passes them in one minute and write it down.
• If possible, repeat the above step four (4) times and record the average number of spins
Optional: you can multiply the average number of spins by 60 to find out how many times the anemometer would spin in an hour and come up with a statement such as: the speed of the wind today is about 1,000 spins per hour.

Related Topics