Chapter: Software Design : Structured System Analysis and Design
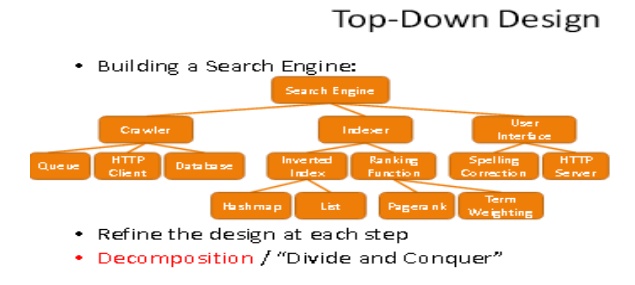
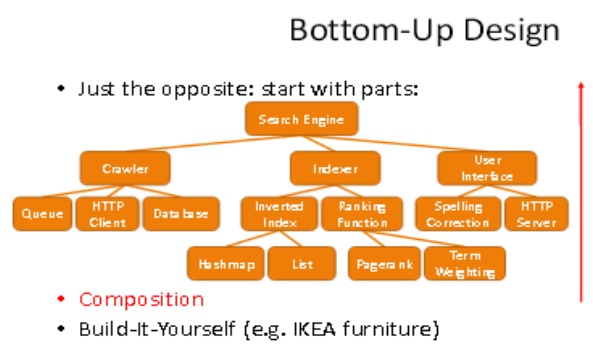
Top-down and Bottom-up Strategies
Top-down and Bottom-up Strategies


Transformation of a DFD into
Structure Chart- Transaction Analysis
·
Break the system into suitably tractable units by
means of transaction analysis
·
Convert each unit into into a good structure chart
by means of transform analysis
·
Link back the separate units into overall system
implementation
The
transaction is identified by studying the discrete event types that drive the
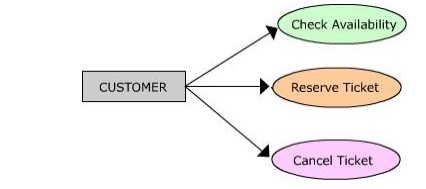
system. For example, with respect to railway reservation, a customer may give
the following transaction stimulus:

The three
transaction types here are: Check Availability (an enquiry), Reserve Ticket
(booking) and Cancel Ticket (cancellation). On any given time we will get customers
interested in giving any of the above transaction stimuli. In a typical
situation, any one stimulus may be entered through a particular terminal. The
human user would inform the system her preference by selecting a transaction
type from a menu. The first step in our strategy is to identify such
transaction types and draw the first level breakup of modules in the structure
chart, by creating separate module to co-ordinate various transaction types.
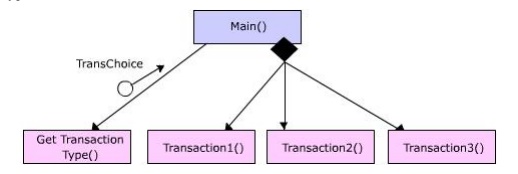
This is shown as follows:

The Main
( ) which is a over-all coordinating module, gets the information about what
transaction the user prefers to do through TransChoice. The TransChoice is
returned as a parameter to Main ( ). Remember, we are following our design
principles faithfully in decomposing our modules. The actual details of how
GetTransactionType ( ) is not relevant for Main ( ). It may for example,
refresh and print a text menu and prompt the user to select a choice and return
this choice to Main ( ). It will not affect any other components in our
breakup, even when this module is changed later to return the same input
through graphical interface instead of textual menu. The modules Transaction1 (
), Transaction2 ( ) and Transaction3 ( ) are the coordinators of transactions
one, two and three respectively. The details of these transactions are to be
exploded in the next levels of abstraction.
We will
continue to identify more transaction centers by drawing a navigation chart of
all input screens that are needed to get various transaction stimuli from the
user. These are to be factored out in the next levels of the structure chart
(in exactly the same way as seen before), for all identified transaction
centers.
Related Topics