Chapter: Control Systems : Time Response Analysis
Time Domain Specifications of a Second Order System
Time Domain Specifications of a
Second Order System
The performance of a system is usually evaluated in terms of the
following qualities. . How fast it is able to respond to the input.
o
How fast it is reaching the desired output
o
What is the error between the desired output and
the actual output, once the transients die down and steady slate is achieved
o
Does it oscillate around the desired value, and
o
Is the output continuously increasing with time or
is it bounded.
o
The last aspect is concerned with the stability of
the system and we would require the system to be stable. This aspect will be
considered later. The first four questions will be answered in terms of time
domain specifications of the system based on its response to a unit step input.
o
These are the specifications to be given for the
design of a controller for a given system.
o
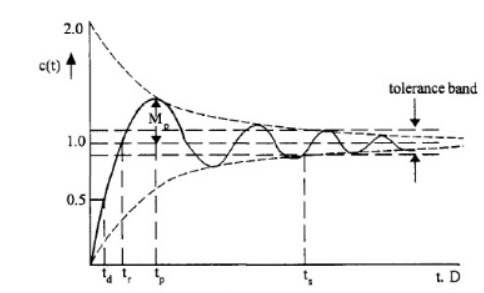
We have obtained the response of a type 1 second
order system to a unit step input. The step
o
response of a typical underdamped second order
system is plotted in Fig.

It is
observed that, for an underdamped system, there are two complex conjugate
poles. Usually, even if a system is of higher order, the two complex conjugate
poles nearest to the j ω - axis
(called dominant poles) are considered and the system is approximated by a
second order system. Thus, in
designing any system, certain design specifications are given based on the
typical underdamped step response shown as Fig.
The
design specifications are
Delay time d t : It is the time required for the
response to reach 50% of the steady state
value for the first time.
Rise time r t : It is the time required for the
response to mach 100% of the steady state
value for under damped systems. However, for over damped systems, it is
taken as the time required for the response to rise from 10% to 90% of the
steady state value.
Peak time p t : It is the time required for the
response to reach the maximum or Peak value
of the response.
Peak overshoot p M : It is defined as the difference
between the peak value of the response
and the steady state value. Iris usually expressed in percent of the steady
state value. If the time for the peak is p
t , percent peak overshoot is given
by,

Related Topics