Chapter: 12th Geography : Chapter 13 : Statistical Techniques
Statistical techniques - Measures of central tendency
Statistical techniques
- Measures of central tendency
One of the most important objectives
of statistical analysis is to get one single value that describes the characteristics
of the entire data. A common word used for measures of central tendency is average.
For example, if we collect the heights of
5000 students of a college, we will have 5000 figures. The persons mind is not capable
of registering all the data at a time. So we need a single figure which represents
the whole data. This single figure is known as average.
Since an average represents the entire
data, its value lies somewhere in between the two extremes i.e. the largest observation
and the smallest observation. For this reason the average is frequently referred
as measure of central tendency.
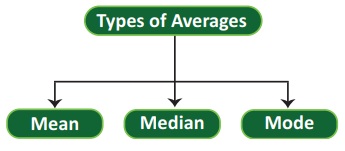
Mean
Mean is defined as the value obtained
by dividing sum of values of all the given items by the number of items. It is also
called as arithmetic mean.
Formula
Mean = Sum of the values of all items
/ Total number of items
Mathematically it can be shown as
X=X1+X2+X3+………….XN
/ N
X= ∑X/N
X=Menu
∑X = Sum of the Values of all items
N = Total number of items
Example
The following are the monthly
average temperature data of Cuddalore District. Find the mean annual temperature
Cuddalore

Solution:
Formula:
![]() =∑X/N
=∑X/N
![]() = 25.3+26.58+28.46+30.61+31.32+30.75+30+29.34
+29.03+27.89+26.45+25.36/ 12
= 25.3+26.58+28.46+30.61+31.32+30.75+30+29.34
+29.03+27.89+26.45+25.36/ 12
![]() = 341.09 12
= 341.09 12
![]() =28.42
=28.42
Answer:
The Mean annual temperature of Cuddalore
district is 28.42
Calculation of Mean for Grouped Data or Continuous Series
Formula:
![]() = A + ∑ fd/N × i
= A + ∑ fd/N × i
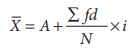
Where
A = Assumed mean
f = frequency
i = class size
d = deviation from assumed mean
N = Total
d = [x – A] / i
Example
Calculate the mean for the following data of heights of the plants in a garden

Solution:
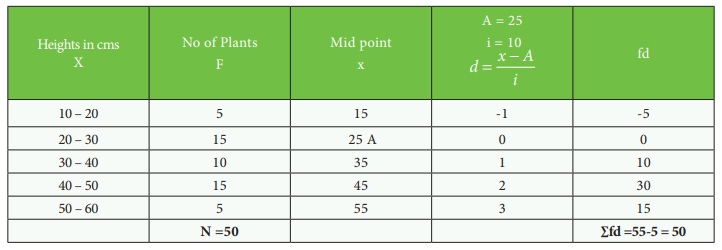
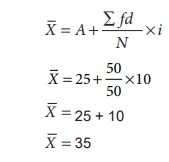
A = 25 , ∑ fd = 50 , N = 50, i = 10
Formula:
Median:
Median is the middle value of a series
arranged in any order – ascending or descending. Median divides the series in to
two equal parts.
Calculation of Median
Example
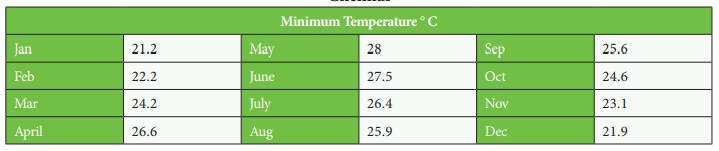
The following are the monthly
minimum temperature of Chennai District. Find the median.
Chennai
Solution:
Step
1:
Arrange the data in Ascending Order

Step
2:
Formula
M = Value of the ([N+1]/2)th item
M = Value of the ([12 +1]/2)th item
M = Value of the (13/2)th
item
M = Value of the 6.5 th item
M = (Size of 6th item + size of 7 item)/2
M = (24.6+25.6) / 2.
Answer: M = 25.1
Calculation of Median for Grouped Data or Continuous Series
Example
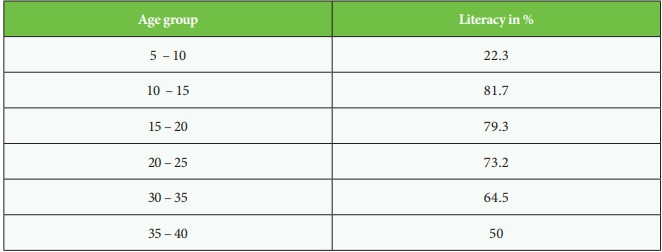
Calculate the median for
the following data
Literates by age in 2001
Solution:
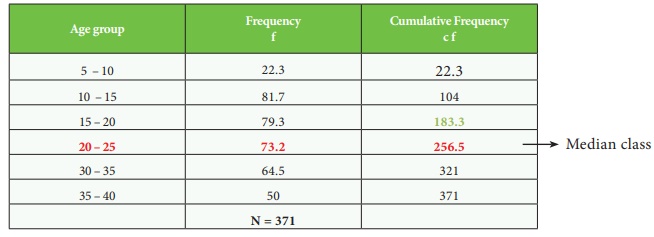
Calculation
of Median Class
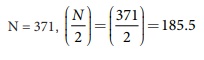
Class corresponding to 185.5 is 20-25 i.e. the Median Class
Formula
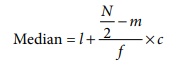
where
I = Lower limit of the median class
N = Total Numbers of frequeny
f = Frequeny of the median class
m = Cumulative frequency of the class
preceding the median class
c = The class interval of the median
class.
Formula
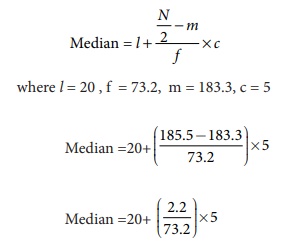
Median
= 20 + (0.03 × 5)
Median
= 20 + 0.15
Answer: Median = 20.15
Mode
Mode is that value which occurs most
frequently in a set of observation or the item which repeats itself the greatest
number of times
Calculation of mode
Example
Calculate mode for the following
data
Station: Cochin
Solution:
From the data 25 is repeated 3
times. Hence the Mode is 25
Answer: Mode = 25
Calculation of mode for Grouped Data
Example
Calculate the mode for following
data
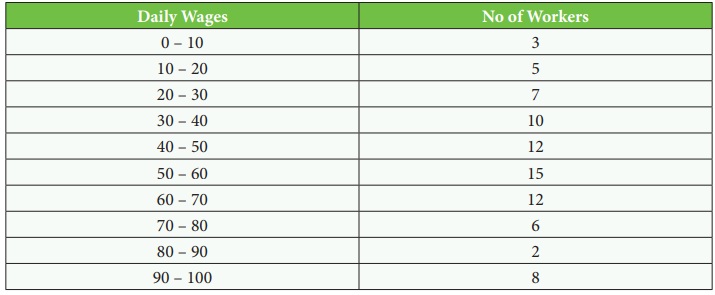
Solution
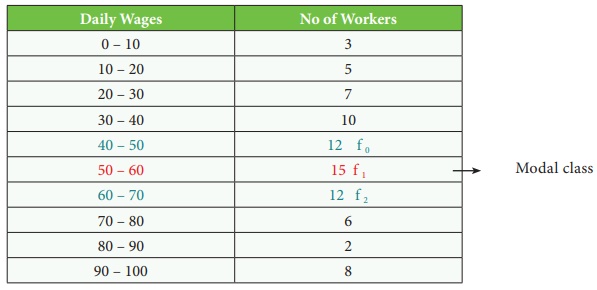
Highest Frequency = 15
Therefore 50 – 60 is the modal class
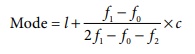
Formula
Modal class is the class which has maximum
frequency.
f1 = frequency of the modal class
f0 = frequency of the class preceding the
modal class
f2 = frequency of the class succeeding
the modal class
c= width of the class limits
I = lower limit of mode interval
l = 50, f0 = 12, f1
= 15, f2 = 12
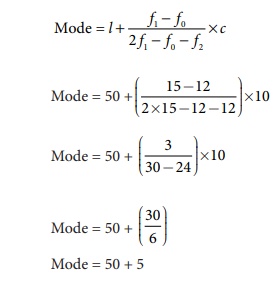
Answer: Mode = 55
Related Topics