Statistical Techniques | Geography - Organisation and Classification of Data | 12th Geography : Chapter 13 : Statistical Techniques
Chapter: 12th Geography : Chapter 13 : Statistical Techniques
Organisation and Classification of Data
Organisation
and Classification of Data
After collecting
data it has to be classified and arranged for further statistical analysis. The
data classified is large in quantity needs to be reduced for further analysis. This
leads to organization of data.
Following steps are important in organization of data
Finding
Range
While organizing the data, it is necessary
to find out the highest and lowest number (maximum and minimum value) from the given
data. The difference between these two extreme values is called range.
Range
= Highest value − Lowest value.
Example
Find out
the range from the following data 2, 6, 4, 9, 12, 8, 5, 8. In this case, highest
value is 12 and lowest value is 2, and the range is 12 – 2 = 10.
Frequency
array
In statistics,
array refers to some kind of orderly arrangement. When the numerical raw data is
arranged in ascending or descending order, it is called array.
Frequency
distribution
It is an
arrangement of data into classes. Following technical terms are important for frequency
distribution.
1. Class
It is a group which divides the variable
into parts and forms a set of given frequency.
Example
2. Class limit
The extreme values of the classes or
groups are called the class limit. Each class has lower limit (minimum value) and
upper limit (maximum value).
For example
in the class 10 − 20, the lower limit is 10 and upper limit is 20.
3. Midpoint
It is obtained by dividing the sum of
lower limit and upper limit by 2.
For example in the class 10 – 20, the
Midpoint10+20/2=15
4. Class interval
It is the difference between the upper
and lower limit of a class.
For
example:
In the class 10 – 20,
The class interval is 20 − 10 = 10
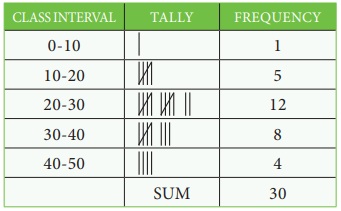
5. Tally Marks
Tally marks usually come in group of
5. For every observation, we put vertical bars called tally marks. After 4 bars
we put a cross stroke for 5th observation. It helps in easy counting of the frequencies.
6. Class Frequency
The number of observations included in
each class is the class frequency or sum of tally marks of that particular class.
7. Total Frequency
It is an aggregate of all class frequencies.
It is the sum of all observations.
Related Topics