Economics - Revenue Analysis | 11th Economics : Chapter 4 : Cost and Revenue Analysis
Chapter: 11th Economics : Chapter 4 : Cost and Revenue Analysis
Revenue Analysis
Revenue
Analysis
The
amount of money that a producer receives in exchange for the sale of goods is
known as revenue. In short, revenue means sales revenue. It is the amount
received by a firm from the sale of a given quantity of a commodity at the
prevailing price in the market. For example, if a firm sells 10 books at the
price of Rs.100 each, the total revenue will be Rs. 1000.
1. Revenue Concepts
The three
basic revenue concepts are: Total Revenue, Average Revenue and Marginal
Revenue.
a. Total Revenue:
Total
revenue is the amount of income received by the firm from the sale of its
products. It is obtained by multiplying the price of the commodity by the
number of units sold.
TR=P × Q
where,
TR
denotes Total Revenue,
P denotes
Price and
Q denotes
Quantity sold.
For
example, a cell-phone company sold 100 cell-phones at the price of Rs. 500 each.
TR is Rs. 50,000. (TR= 500 × 100 = 50,000).
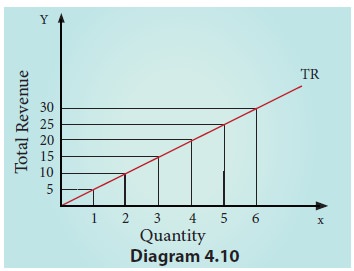
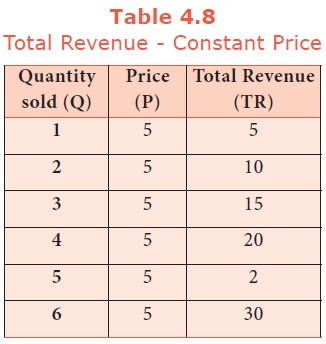
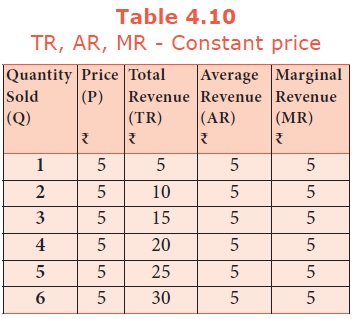
When price is constant, the
behaviour of TR is shown in table 4.8 and diagram 4.10, assuming P=5. When P = 5; TR = PQ
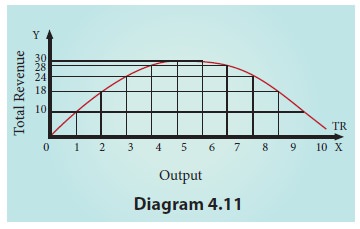
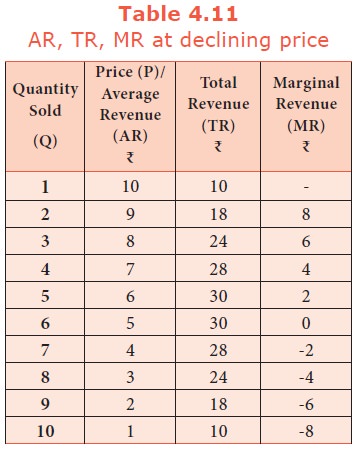
When price is declining with
increase in quantity sold. (Eg. Imperfect Competition on the goods market) the behaviour of TR is shown in table 4.9 and
diagram 4.11. TR can be obtained from Demand fuction: If Q = 11–P,
When P =
1, Q = 10
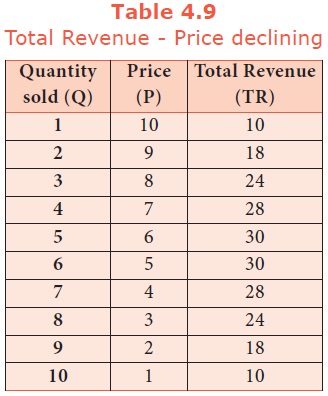
TR = PQ =
1 × 10 = 10
When P =
3, Q = 8, TR = 24
When P =
0, Q = 1, TR = 10
b. Average Revenue
Average
revenue is the revenue per unit of the commodity sold. It is calculated by
dividing the Total Revenue(TR) by the number of units sold (Q)
AR = TR /Q; if TR =
PQ, AR = PQ/Q = P
AR
denotes Average Revenue, TR denotes Total Revenue and Q denotes Quantity of
unit sold.
For
example, if the Total Revenue from the sale of 5 units is Rs 30, the Average
Revenue is Rs.6. (AR= 30/5 =6) It is to be noted that AR is equal to Price.
AR=TR/Q =
PQ/Q=P
c. Marginal Revenue
Marginal
revenue (MR) is the addition to the total revenue by the sale of an additional
unit of a commodity. MR can be found out by dividing change in total revenue by
the change in quantity sold out. MR = ∆TR / ∆Q where MR denotes Marginal
Revenue, ∆TR denotes change in Total Revenue and ∆Q denotes change in total
quantity.
The other
method of estimating MR is:
MR=TRn
–TRn-1 (or) TRn+1 – TRn
where, MR
denotes Marginal Revenue, TRn denotes total revenue of nth
item, TRn-1 denotes Total Revenue of n -1th item and TRn+1
denotes Total Revenue of n+1th item.
If TR =
PQ MR = dTR/dQ = P, which is equal to AR.
2. Relationship between AR and MR Curves
If a firm
is able to sell additional units at the same price then AR and MR will be
constant and equal. If the firm is able to sell additional units only by
reducing the price, then both AR and MR will fall and be different .
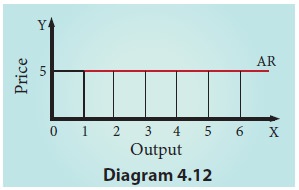
Constant AR and MR (at Fixed Price)
When
price remains constant or fixed, the MR will be also constant and will coincide
with AR. Under perfect competition as the price is uniform and fixed, AR is
equal to MR and their shape will be a straight line horizontal to X axis. The
AR and MR Schedule under constant price is given in Table 4.10 and in the
diagram 4.12
Declining AR and MR (at Declining Price)
When a
firm sells large quantities at lower prices both AR and MR will fall but the
fall in MR will be more steeper than the fall in the AR.
It is to
be noted that MR will be lower than AR. Both AR and MR will be sloping
downwards straight from left to right. The MR curve divides the distance
between AR Curve and Y axis into two equal parts. The decline in AR need not be
a straight line or linear. If the prices are declining with the increase in
quantity sold, the AR can be non-linear, taking a shape of concave or convex to
the origin.

3. Relationship among TR, AR and MR Curves:
When marginal
revenue is positive, total revenue rises, when MR is zero the total revenue
becomes maximum. When marginal revenue becomes negative total revenue starts
falling. When AR and MR both are falling, then MR falls at a faster rate than
AR.
4. TR, AR, MR and Elasticity of Demand
The
relationship among AR, MR and elasticity of demand (e) is stated as follows.
MR = AR ( e-1/e)
The
relationship between the AR curve and MR curve depends upon the elasticity of
AR curve (AR = DD = Price).
a. When
price elasticity of demand is greater than one, MR is positive and TR is
increasing.
b. When
price elasticity of demand is less than one, MR is negative and TR is
decreasing.
c. When
price elasticity of demand is equal to one, MR is equal to zero and TR is
maximum and constant.
It is to
be noted that, a the output range of 1 to 5 units, the price elasticity of
demand is greater than one according to total outlay method. Hence, TR is
increasing and MR is positive.
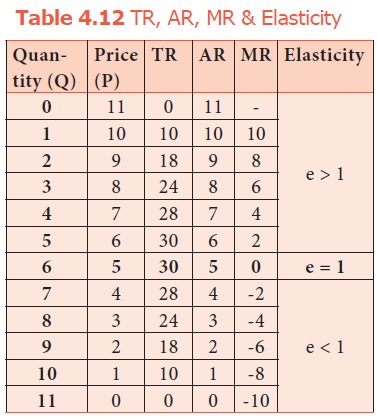
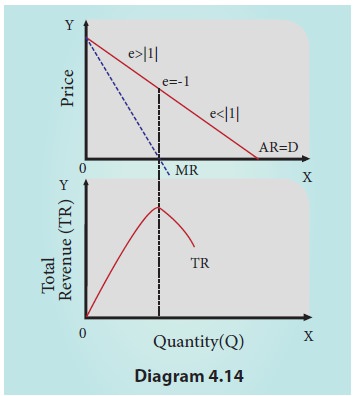
At the output range of 5 to 6 units, the price elasticity of demand is
equal to one.
Hence, TR
is maximum and MR equals to zero.
At the
output range of 6 units to 10 units, the price elasticity of demand is less
than unity. Hence, TR is decreasing and MR is negative.
Related Topics