Information Processing | Term 1 Chapter 6 | 4th Maths - Representation of data in Pie-Chart | 4th Maths : Term 1 Unit 6 : Information Processing
Chapter: 4th Maths : Term 1 Unit 6 : Information Processing
Representation of data in Pie-Chart
Representation
of data in Pie−Chart
A Special chart
that uses "Pie Slices" to show relative sizes of data is called Pie−Chart.
EXAMPLE
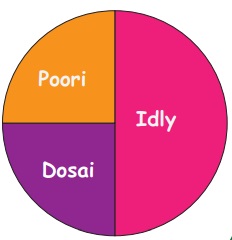
Draw a pie – chart for the given data.
There are 60 students in a class.
Students take breakfast in the restaurant. The half of the students eat idly.
The remaining half of the students eat poori and half of the students eat
Dosai.
Answer
Try This
Answer the following questions by
using given data.
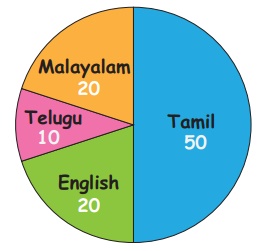
1. Number of people who speak Tamil 50.
2. Number of people who speak English 20.
3. Number of people who speak Malayalam 20.
4. Number of people who speak Telugu 10.
Activities
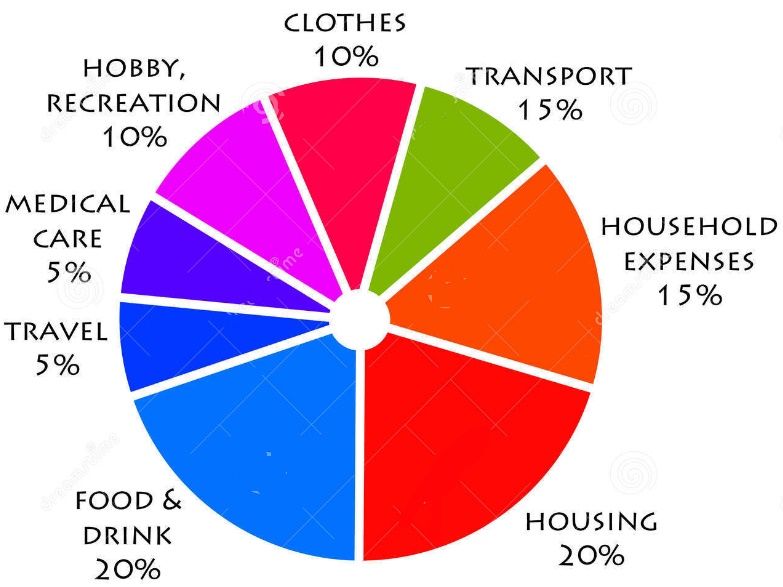
1. Draw a pie – chart for family Budget of food,
bus fare and other expenses.
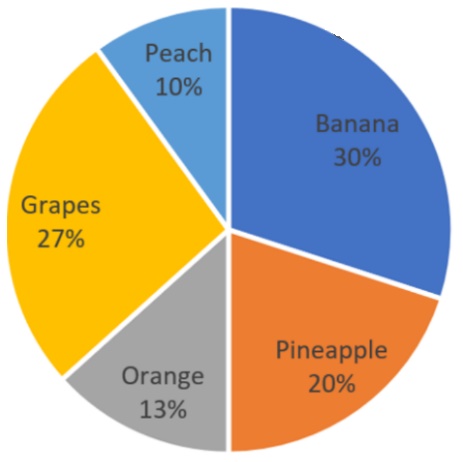
2. Draw a pie − chart for favourite fruits of your friends.
Related Topics