Information Processing | Term 1 Chapter 6 | 4th Maths - Collect and represent data in the form of bar graphs | 4th Maths : Term 1 Unit 6 : Information Processing
Chapter: 4th Maths : Term 1 Unit 6 : Information Processing
Collect and represent data in the form of bar graphs
Collect
and represent data in the form of bar graphs.
Bar Graphs
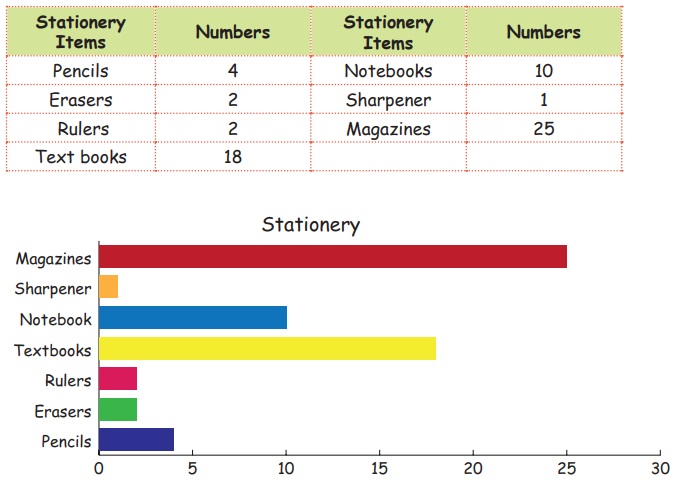
Amirtha was given a task of
maintaining record for stationery items in her home. She started counting one
by one but after a while she lost her counting and worried. Then her friend
Vani came to help her. First she grouped the items. Say, pencils, erasers,
rulers, text books, notebooks, magazines, sharpener. Then Amirtha counted and
wrote as follows.

EXAMPLE
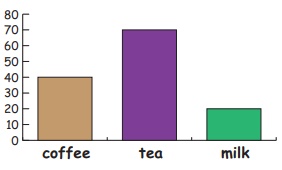
Kalavathi collected information
about the favourite drinks of her schoolmates and represent the data given
below.

(i) The number of coffee drinkers 40
(ii) Which drink is liked least? Milk
(iii) Which is liked most?
(a) Coffee
(b) Tea
(c) Milk
Answer: (b) Tea
Try This
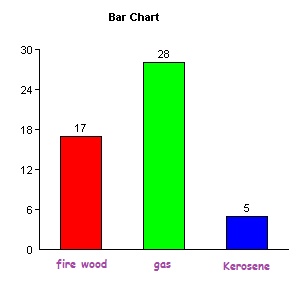
Draw a bar diagram for students using gas, Kerosene and fire wood in their houses.

Related Topics