Information Processing | Term 1 Chapter 6 | 4th Maths - Exercise 6.3 (Representation of data in Pie-Chart) | 4th Maths : Term 1 Unit 6 : Information Processing
Chapter: 4th Maths : Term 1 Unit 6 : Information Processing
Exercise 6.3 (Representation of data in Pie-Chart)
Exercise 6.3
1. Write
down the percentage of Content in human body from the given pie – chart.
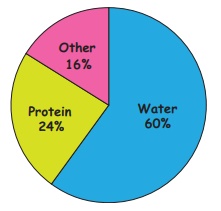
Water: 60%
Protein: 24%
Other: 16%
2. An
ice parlour contains the stock data given below. Answer the following
questions.
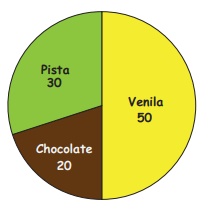
1. How many varieties of Ice creams are there? 3.
2. Find the number of Venila Ice creams 50.
3. Find the total number of Chocolate and Pista
Ice cream 50.
4. Find the total number of Ice creams 100.
3. In
a class of 30 children, absentees record was presented in a graph.
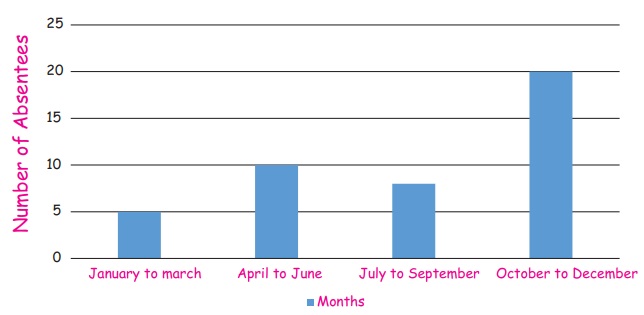
1. In which month there are more
absentees? Can you guess the reasons?
October to December because it is rainy season. Many children fall sick at
that season.
2. In which month there are less
absentees? Discuss the reasons.
January to March. The pupils have to prepare for
the annual examination.
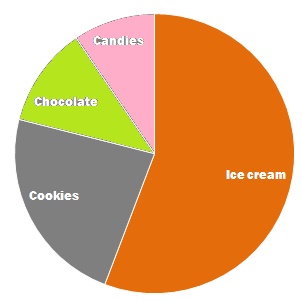
4. Draw
a pie−chart for the favourite sweets of your family members.
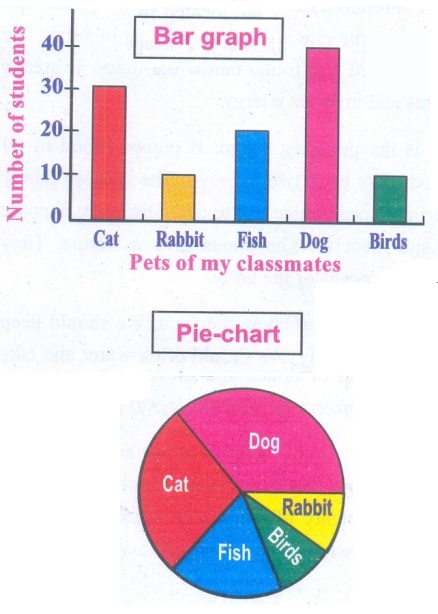
5. Collect
information about the favourite pets of your classmates. Draw bar−graph and pie−chart
for the same data.
Related Topics