Median-Ungrouped, Grouped Frequency Distribution | Formula, Example Solved Problems | Statistics | Maths - Median | 9th Maths : UNIT 8 : Statistics
Chapter: 9th Maths : UNIT 8 : Statistics
Median
Median
The arithmetic
mean is typical of the data because it ‘balances’ the numbers; it is the number
in the ‘middle’, pulled up by large values and pulled down by smaller values.
Suppose four
people of an office have incomes of ₹5000, ₹6000, ₹7000 and ₹8000.
Their mean
income can be calculated as [5000 + 6000 + 7000 + 8000]/4 which gives ₹6500. If
a fifth person with an income of ₹ 29000 is added to this group, then the arithmetic
mean of all the five would be [5000 + 6000 + 7000 + 8000 + 29000] / 5 = 55000/5
= ₹11000. Can one say that the average income of ₹11000 truly represents the income status
of the individuals in the office? Is it not, misleading? The problem here is that
an extreme score affects the Mean and can move the mean away from what would generally
be considered the central area.
In such situations,
we need a different type of average to provide reasonable answers.
Median is the value which occupies the middle position when all the
observations are arranged in an ascending or descending order. It is a positional
average.
For example, the height of nine students in a class are 122 cm, 124 cm, 125 cm,
135 cm, 138 cm, 140cm, 141cm,
147 cm, and 161 cm.
(i)
Usual calculation gives Arithmetic Mean to be 137 cm.
(ii) If the
heights are neatly arranged in, say, ascending order, as follows 122 cm, 124 cm,
125 cm, 135 cm, 138 cm, 140cm, 141cm, 147 cm, 161 cm, one can observe the value
138 cm is such that equal number of items lie on either side of it. Such a value
is called the Median of given readings.

(iii) Suppose
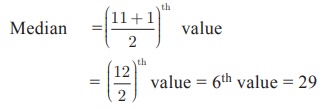
a data set has 11 items arranged in order. Then the median is the 6th item because
it will be the middlemost one. If it has 101 items, then 51st item will be the Median.
If we have
an odd number of items, one can find the middle one easily. In general, if a data
set has n items and n is odd, then the median will be the ([n
+ 1]/ 2)th item.
(iv) If there
are 6 observations in the data, how will you find the Median? It will be the average
of the middle two terms. (Shall we denote it as 3.5th term?) If there are 100 terms
in the data, the Median will be 50.5th term!
In general,
if a data set has n items and n is even, then the Median will be the average
of (n/2)th and ( n/2 + 1)th items.
Example 8.8
The following
are scores obtained by 11 players in a cricket match 7, 21, 45, 12, 56, 35, 25,
0, 58, 66, 29. Find the median score.
Solution
Let us arrange
the values in ascending order.
0,7,12,21,25,29,35,45,56,58,66
The number of values = 11 which is odd
Example 8.9
For the following
ungrouped data 10, 17, 16, 21, 13, 18, 12, 10, 19, 22. Find the median.
Solution
Arrange the
values in ascending order.
10, 10, 12,
13, 16, 17, 18, 19, 21, 22.
The number
of values = 10
Median =
Average of (10/2)th and ( 10/2 + 1)th values
= Average
of 5th and 6th values
= (16 + 17) / 2= 33/2 = 16.5
Example 8.10
The following
table represents the marks obtained by a group of 12 students in a class test in
Mathematics and Science.
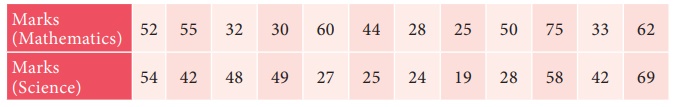
Indicate
in which subject, the level of achievement is higher?
Solution
Let us arrange
the marks in the two subjects in ascending order.
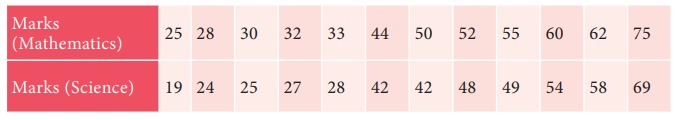
Since the
number of students is 12, the marks of the middle-most student would be the mean
mark of 6th and 7th students.
Therefore
, Median mark in Mathematics = (44+50)/2 = 47
Median mark in Science = (42+42) / 2= 42
Here the median mark in Mathematics is greater
than the median mark in Science.
Therefore,
the level of achievement of the students is higher in Mathematics than Science.
1. Median-Ungrouped Frequency Distribution
(i)
Arrange the data in ascending ( or) decending order of magnitude.
(ii) Construct
the cumulative frequency distribution. Let N be the total frequency.
(iii) If N is odd, median = ([N + 1] /2 )th
observation.
(iv) If N
is even, median = 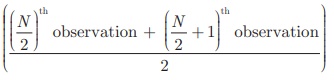
Example 8.11
Calculate
the median for the following data:

Solution
Let us arrange
the marks in ascending order and prepare the following data:
Here N =
41
Median =
size of ([N + 1] / 2)th value = size of ([41 + 1] / 2)th value
= size of 21th value.
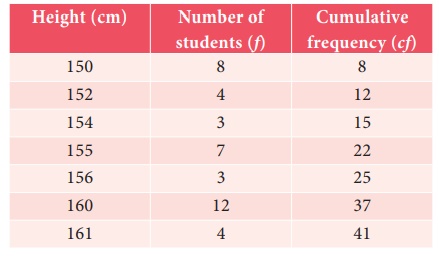
If the 41
students were arranged in order (of height), the 21st student would be the middle
most one, since there are 20 students on either side of him/her. We therefore need
to find the height against the 21st student. 15 students (see cumulative frequency)
have height less than or equal to 154 cm. 22 students have height less than or equal
to 155 cm. This means that the 21st student has a height 155 cm.
Therefore,
Median = 155 cm
2. Median − Grouped Frequency Distribution
In a grouped
frequency distribution, computation of median involves the following
Steps
(i) Construct
the cumulative frequency distribution.
(ii) Find
(N/2)th term.
(iii) The
class that contains the cumulative frequency N/2 is called the median class.
(iv) Find
the median by using the formula:
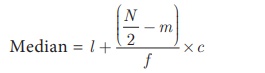
Where l = Lower limit of the median class,
f = Frequency of the median class
c = Width of the median class,
N = The total frequency (∑ f)
m = cumulative frequency of the class
preceeding the median class
Example 8.12
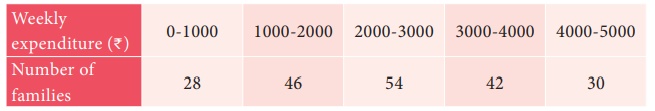
The following
table gives the weekly expenditure of 200 families. Find the median of the weekly
expenditure.
Solution
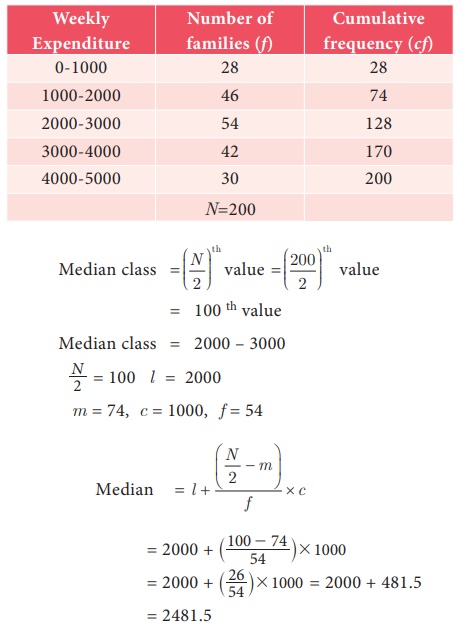
= 2481.5
Progress Check
1. The median of the first four whole numbers _____.
2. If 4 is also included to the collection of first four whole numbers
then median value is ________.
3. The difference between two median is _____.
Example 8.13
The Median
of the following data is 24. Find the value of x.

Solution
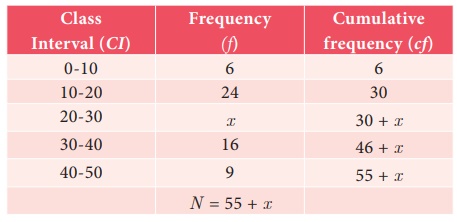
Since the
median is 24 and median class is 20 – 30
L = 20 ; N = 55 + x, m =
30, c = 10, f = x
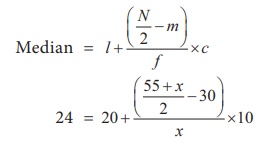
4x = [5 x – 25] / x (after simplification)
4x
= 5x – 25
5x – 4x = 25
x= 25
Note
The median is a good measure of the average value when the data include
extremely high or low values, because these have little influence on the outcome.
Related Topics