Statistics | Maths - Collection of Data | 9th Maths : UNIT 8 : Statistics
Chapter: 9th Maths : UNIT 8 : Statistics
Collection of Data
Collection of Data
Primary data are first-hand original data that we collect ourselves. Primary data collection can be done in a variety of ways such as by conducting personal interviews (by phone, mail or face-to-face), by conducting experiments, etc.,
Secondary data are the data taken from figures collected
by someone else. For example, government-published statistics, available research
reports etc.,
Progress Check
Identify the primary data
(i) Customer surveys
(ii) Medical researches
(iii) Economic predictions
(iv) School results
(v) Political polls
(vi) Marketing details
(vii) Sales forecasts
(viii) Price index details
1. Getting the Facts Sorted Out
When data
are initially collected and before it is edited and not processed for use, they
are known as Raw data. It will not be of much use because it would be too much for the human eye to
analyse.
For example, study the marks obtained by 50 students in mathematics in an examination, given below:
Activity − 1
Prepare an album of pictures, tables, numeric details etc that exhibit
data. Discuss how they are related to daily life situations.
61 60 44
49 31 60 79 62 39 51 67 65 43 54 51 42
52 43 46
40 60 63 72 46 34 55 76 55 30 67 44 57
62 50 65
58 25 35 54 59 43 46 58 58 56 59 59 45
42 44
In this data,
if you want to locate the five highest marks, is it going to be easy? You have to
search for them; in case you want the third rank among them, it is further complicated. If you need how many scored less than,
say 56, the task will be quite time consuming.
Hence arrangement of an array of marks will make the
job simpler.
With some
difficulty you may note in the list that 79 is the highest mark and 25 is the least.
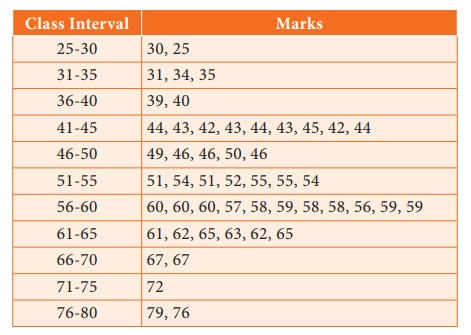
Using these you can subdivide the data into convenient classes and place each mark
into the appropriate class. Observe how one can do it.

From this table can you answer the questions raised above? To answer the question, “how
many scored below 56”, you do not need the actual marks.
You just want “how many” were there. To answer such cases, which often
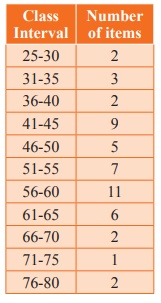
occur in a study, we can modify the table slightly and just note down how many items
are there in each class. We then may have a slightly simpler and more useful arrangement,
as given in the table.

This table gives us the number of items in each class; each such number tells you how many times the required item occurs in the class and is called the frequency in that class.
The table
itself is called a frequency table.
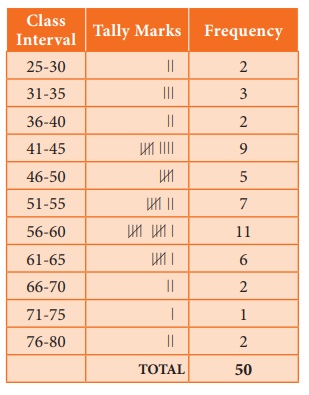
We use what
are known as tally marks to compute thefrequencies. (Under the column ‘number of
items’, we do not write the actual marks but just tally marks). For example, against
the class 31-35, instead of writing the actual marks 31, 34, 35 we simply put |||. You may wonder if for the class 56-60
in the example one has to write ||||||||||| , making it difficult to count. To avoid
confusion, every fifth tally mark is put across the four preceding it, like this ![]() . For example, 11 can be written as
. For example, 11 can be written as  . The frequency table for the above
illustration will be seen as follows:

Note
Consider any class, say 56- 60; then 56 is called the lower limit
and 60 is called the upper limit of the class.
Progress Check
Form a frequency table for the following data:
23 44 12 11 45 55 79 20
52 37 77 97 82 56 28 71
62 58 69 24 12 99 55 78
21 39 80 65 54 44 59 65
17 28 65 35 55 68 84 97
80 46 30 49 50 61 59 33
11 57
Related Topics