Formula, Example Solved Problems | Statistics | Maths - Arithmetic Mean | 9th Maths : UNIT 8 : Statistics
Chapter: 9th Maths : UNIT 8 : Statistics
Arithmetic Mean
Arithmetic Mean
1. Arithmetic Mean-Raw Data
The Arithmetic
Mean of a data is the most commonly used of all averages and is found by adding
together all the values and dividing by the number of items.
For example, a cricketer, played eight (T20) matches and scored the following scores 25, 32, 36, 38, 45, 41, 35,
36.
Then, the
mean of his scores (that is the arithmetic average of the scores) is obtained by
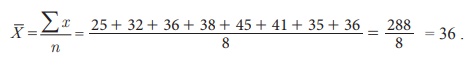
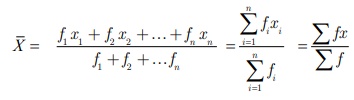
In general, if we have n number of observations x1, x2, x3, …, xn then their arithmetic mean denoted by ![]() (read as X
bar) is given by
(read as X
bar) is given by
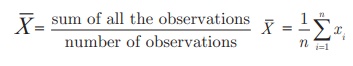
We express
this as a formula: 
Assumed Mean method: Sometimes we can make calculations easy by working from an entry that we guess to be the
right answer. This guessed number is called the assumed mean.
Note
It does not matter which number is chosen as the assumed mean; we
need a number that would make our calculations simpler. Perhaps a choice of number
that is closer to most of the entries would help; it need not even be in the list
given.
In the example
above on cricket scores, let us assume that 38 is the assumed mean. We now list
the differences between the assumed mean and each score entered:
25–38 = –13,
32–38 = –6, 36–38 = –2, 38–38 = 0,
45–38 = 7,
41–38 = 3, 35–38 = –3, 36–38 = –2
The average
of these differences is [–13–6–2 + 0 +7+3–3–2] / 8 = –16/8 = 2
We add this
‘mean difference’ to the assumed mean to get the correct mean.
Thus the
correct mean = Assumed Mean +Mean difference = 38 – 2 = 36 .
This method
will be very helpful when large numbers are involved.
2. Arithmetic Mean-Ungrouped Frequency Distribution
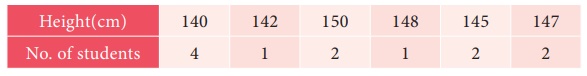
Consider
the following list of heights (in cm) of 12 students who are going to take part
in an event in the school sports.
140, 142,
150, 150, 140, 148, 140, 147, 145, 140, 147, 145.
How will
you find the Mean height?
There are
several options.
(i) You can
add all the items and divide by the number of items.
(14 0 + 142+15
0 + 150 + 14 0 + 148+14 0 + 147+145+14 0 + 147+145) /12
= 1734/12
=144. 5
(ii) You
can use Assumed mean method. Assume, 141 as the assumed mean.
Then the
mean will be given by
= [141] +
[ (−1) +(1) +(9) +(9) +(−1) +(7) +(−1) +(6) +(4) +(−1) +(6) +(4)]/12
= [141] +
[−4+46]/12
=141+ 42/12
= 141+3.5
=144.5
(iii) A third
method is to deal with an ungrouped frequency distribution. You find that 140 has
occurred 4 times, (implying 4 is the frequency of 140), 142 has occurred only once
(indicating that 1 is the frequency of 142) and so on. This enables us to get the
following frequency distribution.
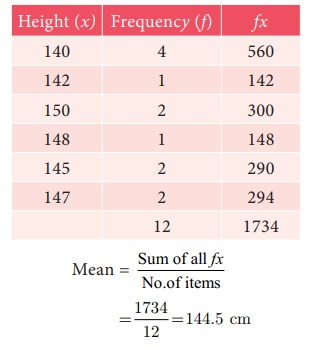
You find
that there are four 140s; their total will be 140 × 4 = 560
There is
only one 142; so the total in this case is 142×1=142
There are
two 150s; their total will be 150×2=300 etc.
These details
can be neatly tabulated as follows:
Looking at
the procedure in general terms, you can obtain a formula for ready use. If x1,
x2, x3, … xn are n
observations whose corresponding frequencies
are f1 , f2 , f3 , … fn
then the mean is given by
Can you
adopt the above method combining with the assumed mean method? Here is an
attempt in that direction:
Note: Study each step and understand
the meaning of each symbol.
(iv) Let the assumed mean be 145. Then we can prepare
the following table:
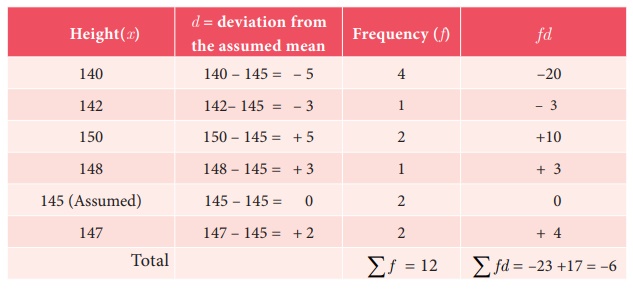
Arithmetic
mean = Assumed mean + Average of the sum of deviations
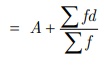
= A + ∑fd/∑f = 145+ (–6/12) = 145.0 – 0.5 = 144.5
When large
numbers are involved, this method could be useful.
3. Arithmetic Mean-Grouped Frequency Distribution
When data
are grouped in class intervals and presented in the form of a frequency table, we
get a frequency distribution like this one:
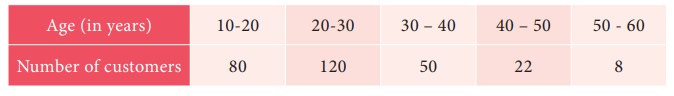
The above
table shows the number of customers in the various age groups. For example, there
are 120 customers in the age group 20 – 30, but does not say anything about the
age of any individual. (When we form a grouped frequency
table the identity of the individual observations
is lost). Hence we need a value that represents
the particular class interval. Such a value is called mid value (mid-point
or class mark) The mid-point or class mark can be found using the formula given
below.
Mid Value = [UCL + LCL] /2, UCL – Upper Class Limit, LCL – Lower Class Limit
In grouped
frequency distribution, arithmetic mean may be computed by applying any one of the
following methods.
(i) Direct
Method (ii) Assumed Mean Method (iii)
Step Deviation Method
(i) Direct Method
When direct
method is used, the formula for finding the arithmetic mean is
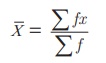
Where x
is the mid-point of the class interval and f is the corresponding frequency
Steps
(i)
Obtain the mid-point of each class and denote it by x
(ii)
Multiply those mid-points by the respective frequency of each class and obtain the
sum of fx
(ii) Divide
∑fx by ∑f to obtain mean
Example 8.1
The following
data gives the number of residents in an area based on their age. Find the average
age of the residents.
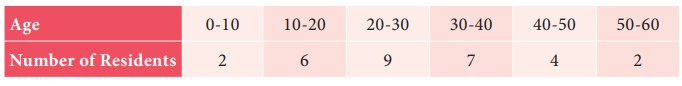
Solution
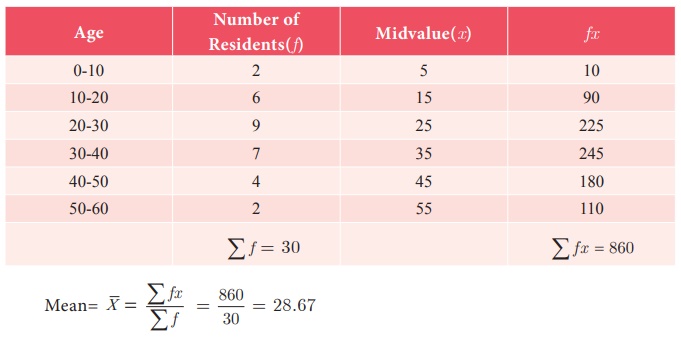
Hence the
average age = 28.67.
(ii) Assumed Mean Method
We have seen
how to find the arithmetic mean of a grouped data quickly using the direct method
formula. However, if the observations are large, finding the products of the observations
and their corresponding frequencies, and then adding them is not only difficult
and time consuming but also has chances of errors. In such cases, we can use the
Assumed Mean Method to find the arithmetic mean of grouped data.
Steps
1. Assume
any value of the observations as the Mean (A). Preferably, choose the middle
value.
2. Calculate
the deviation d = x −
A for each class
3. Multiply
each of the corresponding frequency ‘f ’ with ‘d’ and
obtain ∑fd
4. Apply
the formula 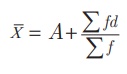
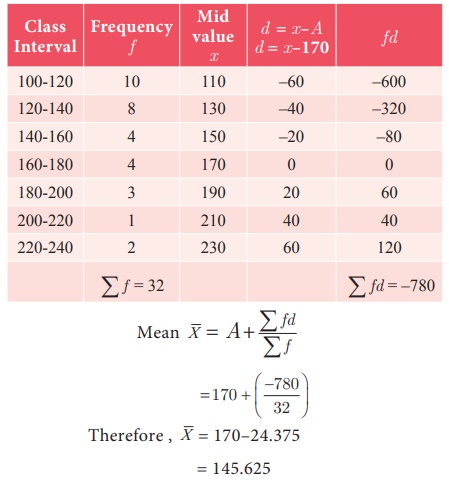
Example 8.2
Find the
mean for the following frequency table:
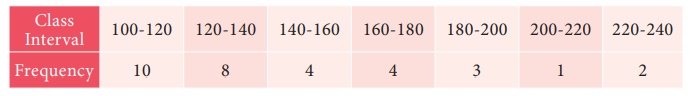
Solution
Let Assumed
mean A = 170
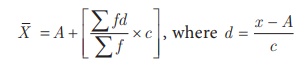
(iii) Step Deviation Method
In order
to simplify the calculation, we divide the deviation by the width of class intervals
(i.e. calculate (x –A) / c) and then multiply by c in the
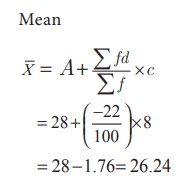
formula for getting the mean of the data. The formula to calculate the Arithmetic
Mean is
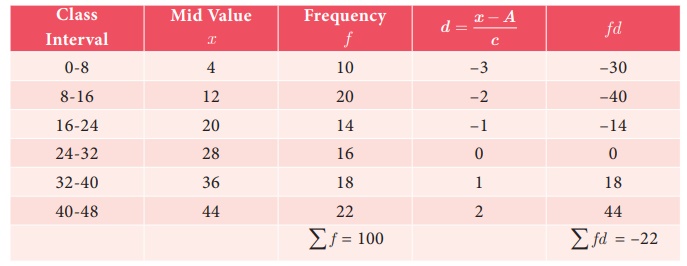
Example 8.3
Find the
mean of the following distribution using Step Deviation Method.
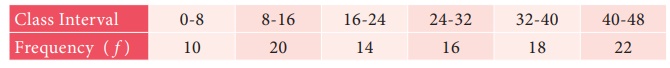
Solution
Let Assumed
mean A = 28, class width c =8
Note
• When xi and fi are small, then
Direct Method is the appropriate choice.
• When xi and fi are numerically
large numbers, then Assumed Mean Method or Step Deviation Method can be used.
• When class sizes are unequal and d numerically large,we
can still use Step Deviation Method.
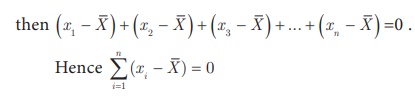
4. A special property of the Arithmetic Mean
1. The sum of the deviations of the
entries from the arithmetic mean is always zero.
If x1
, x2, x 3 ,..., xn are n
observations taken from the arithmetic mean ![]()
2. If each observation is increased
or decreased by k (constant) then the arithmetic mean is also increased or decreased by k respectively.
3. If each observation is multiplied
or divided by k, k ≠ 0, then the arithmetic
mean is also multiplied or divided by the same quantity k respectively.
Example 8.4
Find the sum of the deviations from the arithmetic mean
for the following observations:
21, 30, 22,
16, 24, 28, 18, 17
Solution
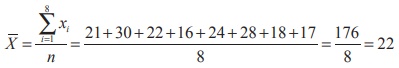
Deviation
of an entry xi from the arithmetic mean ![]() is xi
−
is xi
− ![]() , i = 1, 2, ...8.
, i = 1, 2, ...8.
Sum of the
deviations
= (21-22)+(30-22)+(22-22)+(16-22)+(24-22)+(28-22)+(18-22)+(17-22)
= 16–16 = 0. or equivalently,

Hence, we
conclude that sum of the deviations from the Arithmetic Mean is zero.
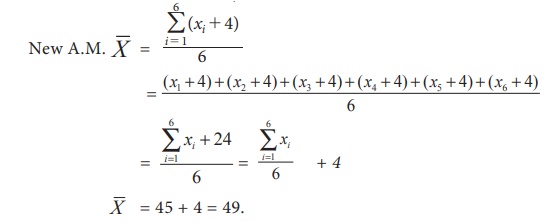
Example 8.5
The arithmetic
mean of 6 values is 45 and if each value is increased by 4, then find the arithmetic
mean of new set of values.
Solution
Let x1,
x2, x3, x4, x5,
x6 be the given set of values then

If each value
is increased by 4, then the mean of new set of values is
Progress Check
Mean of 10 observations is 48 and 7 is subtracted to each observation,
then mean of new observation is __________
Example 8.6
If the arithmetic
mean of 7 values is 30 and if each value is divided by 3, then find the arithmetic
mean of new set of values
Solution
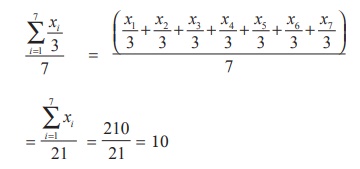
Let X represent the set of seven values x1 , x2 , x3
, x4 , x5 , x6 , x7.
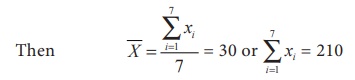
If each value
is divided by 3, then the mean of new set of values is
Aliter
If Y
is the set of values obtained by dividing each value of X by 3.
Then,  30/3 = 10.
Progress Check
1. The Mean of 12 numbers is 20. If each
number is multiplied by 6, then the new mean is __
2. The Mean of 30 numbers is 16. If each
number is divided by 4, then the new mean is___
Example 8.7
The average
mark of 25 students was found to be 78.4. Later on, it was found that score of 96
was misread as 69. Find the correct mean of the marks.
Solution
Given that
the total number of students n = 25, ![]() =
78.4
=
78.4
So, Incorrect
∑x = ![]() × n = 78.4 × 25 = 1960
× n = 78.4 × 25 = 1960
Correct ∑x = incorrect ∑x − wrong entry + correct
entry
= 1960 −
69 + 96 = 1987
Correct ![]() = correct ∑x / n = 1987/25 = 79.48
= correct ∑x / n = 1987/25 = 79.48
Progress Check
There are four numbers. If we leave out any one number, the average
of the remaining three numbers will be 45, 60, 65 or 70. What is the average of
all four numbers?
Related Topics