Vital Statistics - Life Table and Its Applications | 12th Statistics : Chapter 8 : Vital Statistics and Official Statistics
Chapter: 12th Statistics : Chapter 8 : Vital Statistics and Official Statistics
Life Table and Its Applications
Life Table and Its Applications
A Life Table is a presentation of summary of the mortality
experiences of a community during a given period in the form of a table. The
Life Table exhibits the number of persons living and dying at each age, on the
basis of the experience of a cohort . It also gives the probability of dying and
living separately. The Life Table tells the life history of a cohort.
Cohort is a group of individuals who born at the same time and experienced
the same
mortality conditions.
Uses of Life Table
·
Actuaries compute rate of premiums for persons of different age
groups using Life Table.
·
It helps to assess the accuracy of census figures, death and birth
registrations.
·
It helps to evaluate the impact of family planning on population
growth.
·
It enables to assess the increase in the life span due to new
scientific inventions, sophisticated medical treatments and improved living
conditions.
·
Estimates of migration can be made from Life Table.
Construction of Life Table
Construction of Life Table begins with a cohort population. The
following are the standard set of components of a Life Table:
(i) Age (x)
(ii) Survivorship function
(iii) Number of deaths in the age interval (x,
x+1)
(iv) Probability for a person surviving at the
age x to die before x+1 years
(v) Probability for a person aged x years
to survive upto x+1 years
(vi) Number of persons lived in aggregate in the
age interval (x,x+1)
(vii) Number of years lived by the cohort at and above the age x
years
(viii) Expectation of life.
These components are described below with their respective
notations and formula required to compute each of them.
(i) x : Age, in years
(ii) l(x): Number of survivors at
the exact age of x years.
For instance, l(25) denotes the number of persons who
survive to the moment of attaining age 25 years. Hence, l(x) is a
decreasing function of x.
l(0) is called radix of the Life Table
or cohort, which is conventionally taken as 1,00,000.
(iii) d(x): Number of persons
among l(x) persons who die before reaching the age x years.
i.e., d(x) = l(x) – l(x+1)
(iv) q(x): Probability for a person surviving at the
age x will die before x+1 years. i.e., q(x) = d((x)) / l x
It is the proportion of persons dying between the ages of x
and x +1 to the number of persons surviving at the age of x
years, i.e., at the beginning of the corresponding age interval.
(v) p(x): Probability for a person aged x years
to survive up to x+1 years
p(x) = 1 − q(x), or equivalently, p ( x) = l ( x +1)
/ l ( x)
It is the proportion of persons surviving up to (x + 1)
years to the number of persons at the
age of x years.
(vi) L(x): Number of persons lived in aggregate in
the age interval (x,x+1)
i.e., L(x) = l(x) + l(x + 1) / 2
or equivalently
L ( x ) = l ( x ) – 1/2 d ( x)
(vii) T(x): Number of years lived
by the cohort at and above the age x i.e., T(x)
= L(x)+L(x+1)+L(x+2)+ ...
or equivalently
T(x+1) = T(x) – L(x).
Total number of years lived by the cohort after x years of
age.
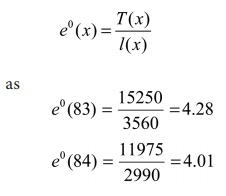
(viii) e0(x):
Expectation of life
e 0( x) =
T ( x) / l ( x)
It gives the average number of years a person of age x
years is expected to survive under the existing mortality conditions.
Assumptions of Life Table
The following assumptions are made while constructing a Life
Table.
(i) There is no effect of immigration and emigration on the cohort. It means that the
reduction in the number of the initial cohorts is merely due to deaths.
(ii) The size of cohort begins with a convenient figure, it is
conventionally 1,00,000.
(iii) Deaths are uniformly distributed over each age interval.
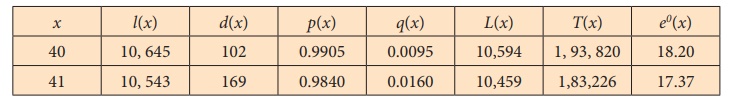
Example 8.6
A Life Table was constructed for a cohort. The following is a
section of the table, wherein some of the entries are not available. Find the
estimates of missing values and complete the Life Table.
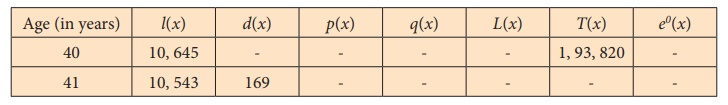
Solution:
The Life Table can be completed using the relationship among
missing terms and other terms.
The number of persons who die before reaching age 40 years is
calculated as
d(40) = l(40) – l(41)
= 10645 – 10543
Therefore, d(40) = 102.
Values of q(x) are estimated as
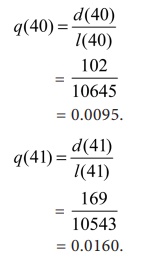
Values of p(x) are estimated from the corresponding values
of q(x) as
p(40) = 1 – q(40)
= 1 – 0.0095 = 0.9905
p(41) = 1 – q(41)
= 1 – 0.0160 = 0.9840
Values of L(x) are estimated using its relationship with l(x)
and d(x) as follows:
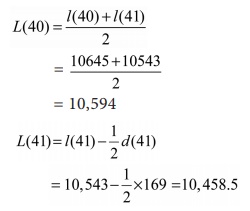
= 10,459 (Approx.)
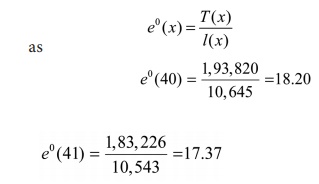
The value of T(41) is estimated from the given value of T(40)
and the estimated value of L(40) from the relationship
T(41) = T(40) – L(40)
as T(41) = 193820 – 10594
= 1,83,226.
The life expectancy of the cohort at the age x = 40 and 41 years can be
estimated using the relationship
Now, the completed Life Table becomes as
Example 8.7
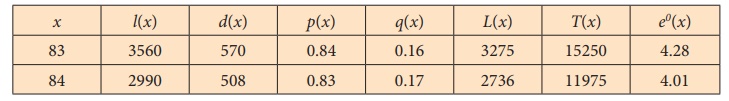
The following is a part of the Life Table constructed for a
population, where the contents are incomplete. Evaluate the missing values
using the given data and complete the Life Table.
Solution:
Values of the missing entries can be estimated from the given data
applying the respective formulae as follows:
The number of persons who die before reaching age of 83 years is
calculated as
d(83) = l(83) × q(83)
= 3560 × 0.16
= 569.6 = 570
The value of the survivorship function l(x) at x =
84 years is estimated as
l(84) = l(83) – d(83)
= 3560 – 570
= 2990
Values of p(x) are estimated from the corresponding values
of q(x) as
p(83) = 1 – q(83)
= 1 – 0.16 = 0.84
p(84) = 1 – q(84)
= 1 – 0.17 = 0.83
Values of L(x) are estimated using its relationship with l(x)
and d(x) as follows:
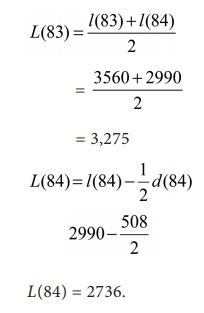
The value of T(83) can be estimated from the given value of
T(84) and the estimated value of L(83) from the relationship
T(84) = T(83) – L(83)
T(83) = L(83) + T(84)
as
T(83) = 3,275 + 11975 = 15,250
The life expectancy of the cohort at the age x = 83 and 84 years is
estimated using the
relationship
Now, the completed Life Table is as follows:
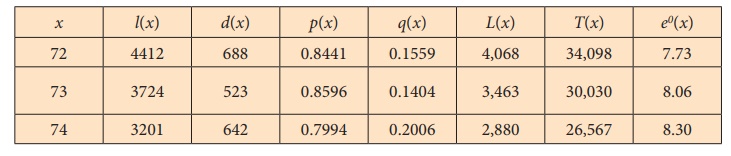
Example 8.8
A part of the Life Table of a population is given hereunder with
incomplete information.
Find those information from the given data and complete the Life
Table.
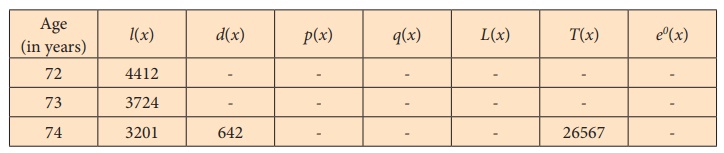
Solution:
Values of the missing entries can be calculated from the given
data applying the respective formulae as follows:
The number of persons who die before reaching age x = 72
and 73 years can be calculated as d(72) = l(72) – l(73)
= 4412 – 3724
= 688
d(73) = l(73) – l(74)
= 3724 – 3201
d(73) = 523.
Values of q(x) are estimated as
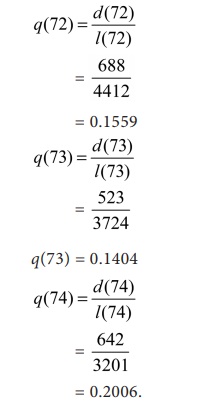
Values of p(x) are estimated from the corresponding values
of q(x) as
p(72) = 1 – q(72)
= 1 – 0.1559 = 0.8441
p(73) = 1 – q(73)
= 1 – 0.1404 = 0.8596
p(74) = 1 – q(74)
= 1 – 0.2006 = 0.7994.
Values of L(x) are estimated using its relationship with l(x)
and d(x) as follows:
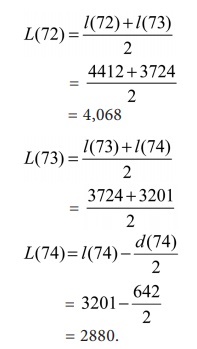
The value of T(x) is estimated for x = 72 and 73
from the given value of T(74) and the estimated values of L(72)
and L(73) as
p(73) = L(73) + T(74)
= 3463 + 26567 = 30,030.
p(72) = L(72) + T(73)
4068 + 30030 = 34,098.
The life expectancy of the cohort at the age x = 72, 73 and 74 years is
estimated using the relationship
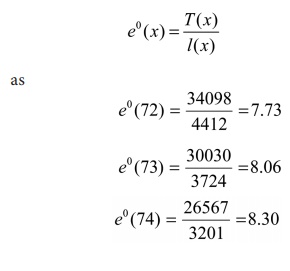
The completed Life Table is as follows:
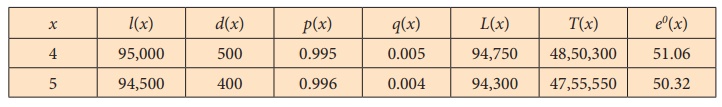
Example 8.9
Find the missing values in the following Life Table:
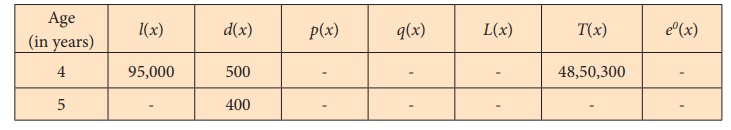
Solution:
Value of the survivorship function l(x) at x = 5
years can be estimated as
l(5) = l(4) – d(4)
= 95000 – 500
= 94500
Values of q(x) are estimated as
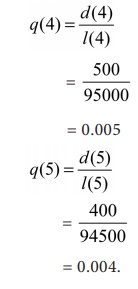
Values of p(x) are estimated from the corresponding values
of q(x) as
p(4) = 1 – q(4)
= 1 – 0.005 = 0.995
p(5) = 1 – q(5)
= 1 – 0.004 = 0.996.
Values of L(x) are estimated using its relationship with l(x)
and d(x) as follows:
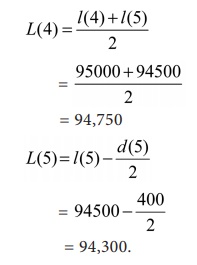
The value of T(5) is estimated from the given value of T(4)
and the estimate of L(4) as
T(5) = T(4) – L(4)
T(5) = 4850300 – 94750 = 47,55,550.
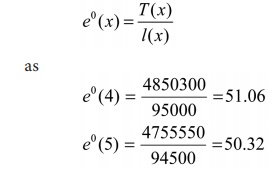
The life expectancy of the cohort at the age x = 4 and 5 years is
estimated using the relationship
The completed Life Table is
Related Topics