Chapter: Electric Energy Generation and Utilisation and Conservation : Illumination
Laws of illumination
Lumen
The lumen (symbolized lm) is the International Unit of luminous flux. It is defined in terms of candela steradians (cd multiplied by sr). One lumen is the amount of light emitted in a solid angle of 1 sr, from a source that radiates to an equal extent in all directions, and whose intensity is 1 cd.
Luminous intensity
Luminous intensity is an expression of the amount of light power emanating from a point source within a solid angle of one steradian.
Laws of illumination:
The original standard of light was Wax Candle, which is highly unreliable. It was replaced by a Vaporized Pentane Lamp. This is equal to10 original Candles. In the year 1909, Incandescent Lamp was taken as standard by comparison with a Pentane Lamp. Thing to be kept in mind is Primary Standard should be reproducible.It was in1948, Luminous Intensity; based on Luminance (objective brightness) of a small aperture due to Light from a Radiator maintained at1773°c i.e. Solidification temperature of platinum was adopted as Standard. It consists of:
1. Radiator – Fused Thoria – Thorium Oxide. 45mm long internal dia of 2.5mm. Packed with Fused Thoria Powder at the bottom.
2. Supported Vertically Pure Platinum in a Fused thoria crucible with a small aperture of 1.5mm in a large refractory container.
3. Platinum melted by a High Frequency Eddy current.Luminance = 589000 Candles /m2 ≈600 000 units.
Transparent (Law of Inverse Squares):
Common unit of light intensity is candela. It is Luminous intensity in the Perpendicular direction of a surface, 1 / 600,000 of a black body at temperature of solidification or Freezing of Platinum under Standard Atmospheric pressure. It is abbreviated as Cd. It is indicative of Light Radiating Capacity of a source of Lamp.
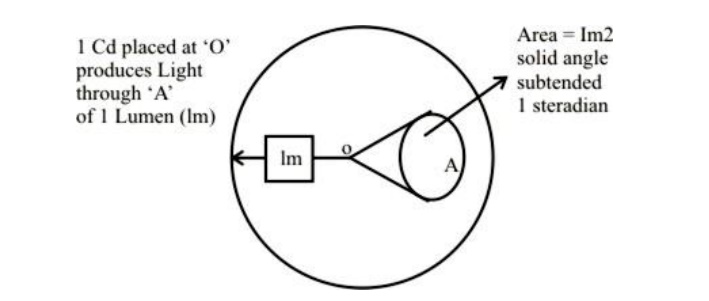
Consider a transparent sphere of radius 1m shown in Fig. If we place a 1 Cd source at the centre then light flux coming out through an area of 1m2 over 1 steradian solid angle will be 1 lumen.
Thus Luminous Intensity over 1 Str. by 1, Cd, we call it 1 lumen ≈ 1 lm. Basic unit of Light Flux.
∴ Total Flux = 4 π lumens, out of the sphere in Fig .
If the Solid Angle be dω and Luminous Intensity I Cd at the center then Luminous flux in dω =dφ = I dω lm.
Yet another important unit is MSLI. It means Mean Spherical Luminous Intensity. Average value of Luminous Intensity in all directions. Therefore for the case in Fig
φ = I 4πlumens
Now we define Luminous intensity on a surface. It is known as Illuminance. It is Luminous Flux per unit area or lumens per sq m. = lumen / m2 = lm / m2 = lux (lx).
Frechner’s law:
Weber in 1830 found that I – Stimulus (Intensity) produces dI – Least perceptible increment affecting sense organs. Then the ratio
dI/i= Constant Under fixed
Fatigue
1) Attention and
2) Expectation.
Thus we have sensitivity given by the equation
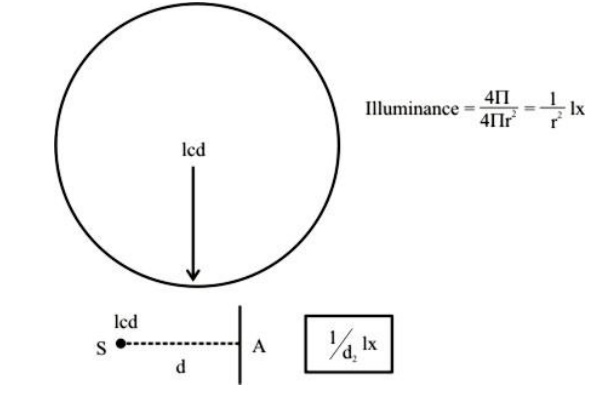
Here I0 is the threshold intensity. This is known as Frechner’s Law. The same percentage change in stimulus Calculated from the least amount perceptible. Gives same change in sensation. Sensations produced by optic nerves have logarithmic dependence or relationship to Light Radiation producing the sensation.Intensity of Illumination produced by a point source varies inversely as square of the distance from the source. It is given by the equation and as shown in Fig
E = I / D
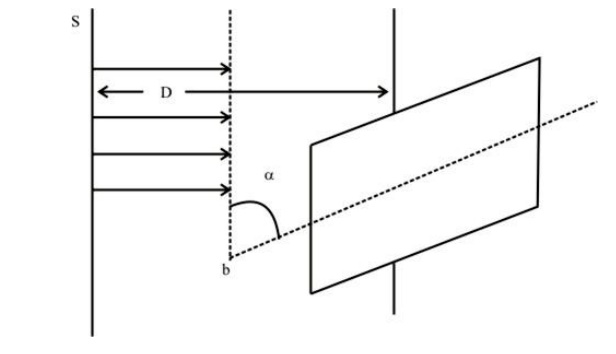
Lambert’s Cosine Law of Incidence
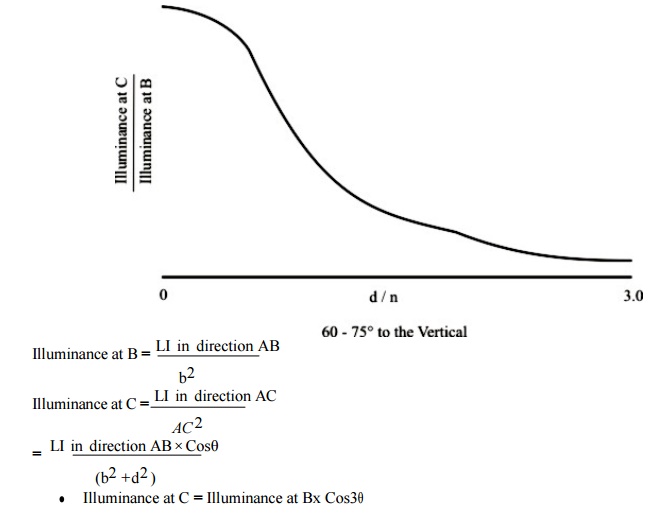
E = I cos / D2
This – tells us the variation of Illuminance on arbitrary surface inclined at an angle of α. As shown in Fig
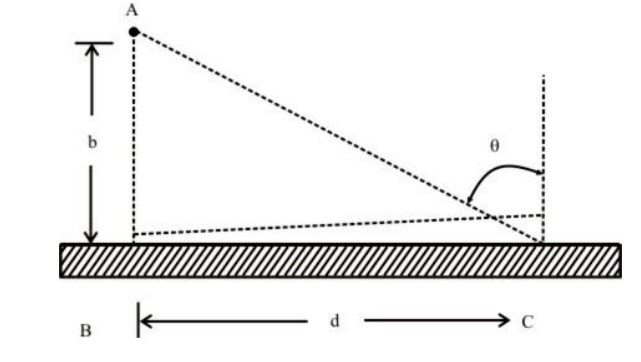
Above Fig.shows a lamp placed at A, the bm above the floor. For this scheme below Fig shows It is well known that Illuminance is maximum under the lamp at variation of Illuminance on the floor. It is well known that Illuminance is maximum under the lamp at ‘B’.
Next is to measure the candle power of the lamp. Typical measurement can be done using a photometric bench shown in Fig. 7 where IS represents standard lamp. IX represents test lamp. There is a screen at the centre called photometer head, adjusted for equal brightness on either side. Applying inverse law one can arrive at the value of IX.
This lesson introduced the primary standard and other terminology related to measurement of light flux.
Photometry:
Primary Standard was defined in an earlier lecture based on the brightness of a body (i.e. black body) maintained at Freezing Temperature of platinum. Unit of Luminous Intensity abbreviated as is candela cd (z). Light Flux hence emanating from a point source in all directions is Illuminance - ¼ π lumens and is termed msli is the light flux incident on a task surface in lumens per unit area and is called lux. Comparison with a standard. Normally Primary standards are kept in standards Laboratories. Usually Incandescent Lamp Compared with a Primary standard is used as a Laboratory Standard. The test source / lamp is compared With the Laboratory Standard. However, Incandescent Lamp not suitable beyond 50 – 100 hours Standardization of Lamp is by voltage rating Current rating and wattage.
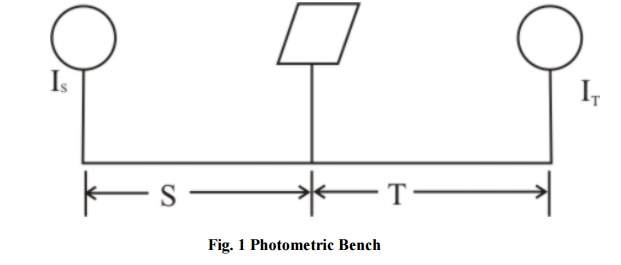
These measurements comprise photometry. They employ a Photometric Bench with a photometric head which is an opaque screen. These measurements involve compassing the test lamp with standard lamp
a. By varying the position of comparison lamp (standard Lamp) Is b. By varying the position of the test lamp IT
c. By varying the position of the screen
Measurement is complete when the bench is balanced. It is balanced when two sides of the screen are equally bright [in a Dark Room] as shown in Fig.1
Photometric Bench:
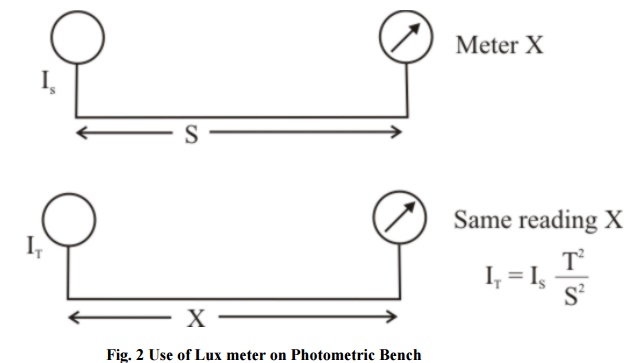
Measurements may be made on Illumination meter or Lux meter also in this instead of the screen adjust the meter to get the same reading on photometric bench. Fig.2. shows a method where distance is varied to get the same reading on the meter.
Alternatively, the distance on the bench may be kept constant and readings on the meter are noted.
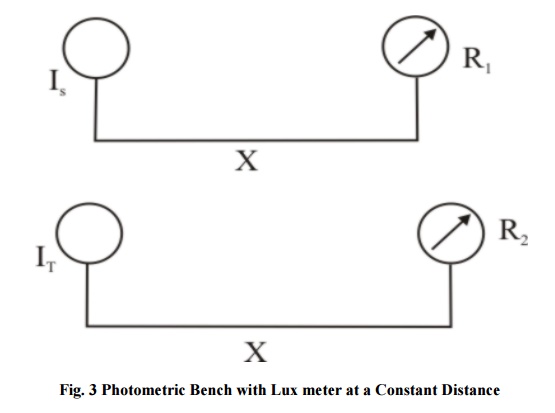
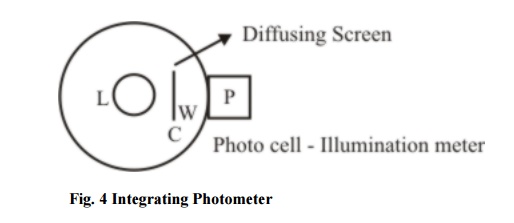
Fig 4 shows a typical photo meter. It has a standard point source ‘L’ of Light at the centre of a opaque sphere. It has an opening W where a photo cell is placed that receives diffused light from the source. Window ‘W’ is shielded by diffusing screen ‘C’ from direct light. Reading on the micrometer is first taken with a standard Lamp and later with the test Lamp.
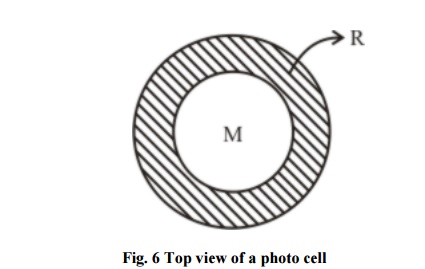
Fig. 5 shows the photocell employed in a photometer. In a photocell sensitive element ‘S’ is selenium coated in the form of a thin layer on a steel plate P. This is in turn covered with a thin layer of Metal ‘M’ on which is a collection ring R.
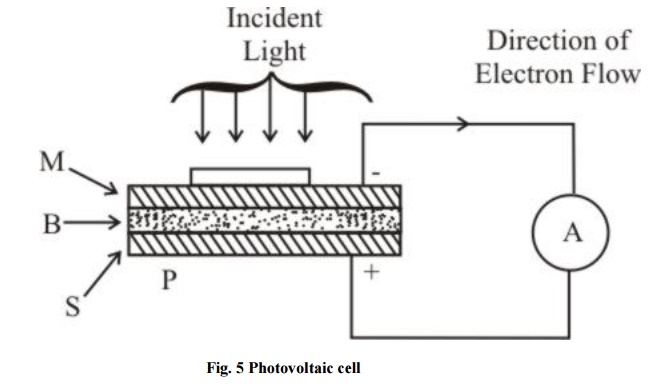
Sensitive element is a semi-conductor that releases electrons upon exposure to light. Selenium and Cuprous oxide are most suitable semi-conductor materials. Steel Plate ‘P’ coated with thin layer of Selenium at 200°c and annealed at 80°c Producing crystalline form. It is in turn coated by a thin transparent film of metal ‘M’ with a collection ring ‘R’ of metal.
B is the barrier Layer Upon exposure to light – light enters through ‘M’ releases electrons from metallic Selenium. They cross barrier ‘B’ to ‘M’ and are collected through ‘R’ and P Current indicated by (A) is proportional to Illuminance. Often (A) is a micro ammeter calibrated in lm.
The next aspect of photometry is to look at the luminance curves of the Lamps. Here comes the role of Luminaries. Luminaries primarily provide the physical support to the Lamps. They may be directing, globes, reflecting or refracting. They could be supported on the walls using wall branects. They may be portable units on pole mounted in case of street Light. In all cares we need light distribution curves. Light distribution curves are curves giving Variation of Luminous intensity with angle of emission in a Horizontal plane i.e. Polar angle Azimuth or Vertical plane, passing though centre.
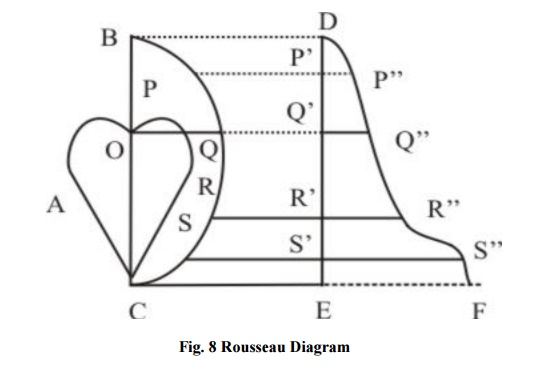
Fig 7 shows a typical Polar Luminance distribution curve of a point source of Light. From a Polar Curve in order to arrive at msli of the lamp a Rousseau diagram is constructed. Fig 8 shows such a construction.
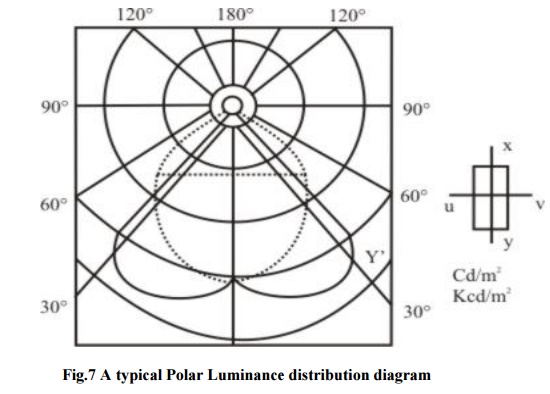
Consider the Polar curve A for the typical lamp with O as centre of the Lamp Draw a semicircle of convenient radius OB = OC Insert no. of radii. From the top of there radial segments. From the tip of the radial segments draw horizontal lines extended to cut the vertical line to scale depending on length of Radic. Then the average width of the curve DP “Q” R “S” F is msli.
Related Topics