Chapter: Measurements and Instrumentation : Storage and Display Devices
Digital Storage Oscilloscope: Block Diagram, Explanation, Advantages

Digital Storage Oscilloscope
Block Diagram
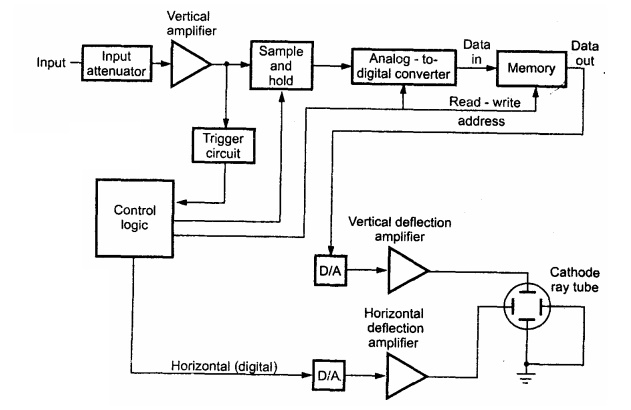
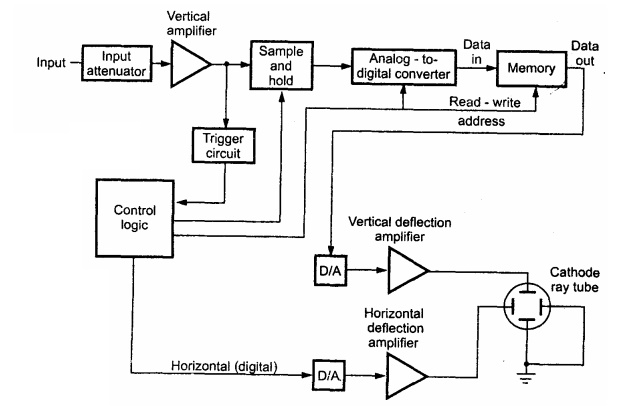
The block diagram of digital storage oscilloscope is shown in the Fig.

Ø The input signal is applied to the amplifier and attenuator section.
Ø The oscilloscope uses same type of amplifier and attenuator circuitry as used in the conventional oscilloscopes.
Ø The attenuated signal is then applied to the vertical amplifier.
Ø To digitize the analog signal, analog to digital (A/D) converter is used.
Ø The output of the vertical amplifier is applied to the A/D converter section.
Ø The successive approximation type of A/D converter is most oftenly used in the digital storage oscilloscopes.
Ø The sampling rate and memory size are selected depending upon the duration & the waveform to be recorded.
Ø Once the input signal is sampled, the A/D converter digitizes it.
Ø The signal is then captured in the memory.
Ø Once it is stored in the memory, many manipulations are possible as memory can be readout without being erased.
Ø The digital storage oscilloscope has three modes:
1. Roll mode
2. Store mode
3. Hold or save mode.
Advantages
i) It is easier to operate and has more capability.
ii) The storage time is infinite.
iii) The display flexibility is available. The number of traces that can be stored and recalled depends on the size of the memory.
iv) The cursor measurement is possible.
v) The characters can be displayed on screen along with the waveform which can indicate waveform information such as minimum, maximum, frequency, amplitude etc.
vi) The X-Y plots, B-H curve, P-V diagrams can be displayed.
vii) The pretrigger viewing feature allows to display the waveform before trigger pulse.
viii) Keeping the records is possible by transmitting the data to computer system where the further processing is possible
ix) Signal processing is possible which includes translating the raw data into finished information e.g. computing parameters of a captured signal like r.m.s. value, energy stored etc.
Related Topics