Chapter: Medical Physiology: Electrocardiographic Interpretation of Cardiac Muscle and Coronary Blood Flow Abnormalities: Vectorial Analysis
Current of Injury - Electrocardiographic Interpretation of Cardiac
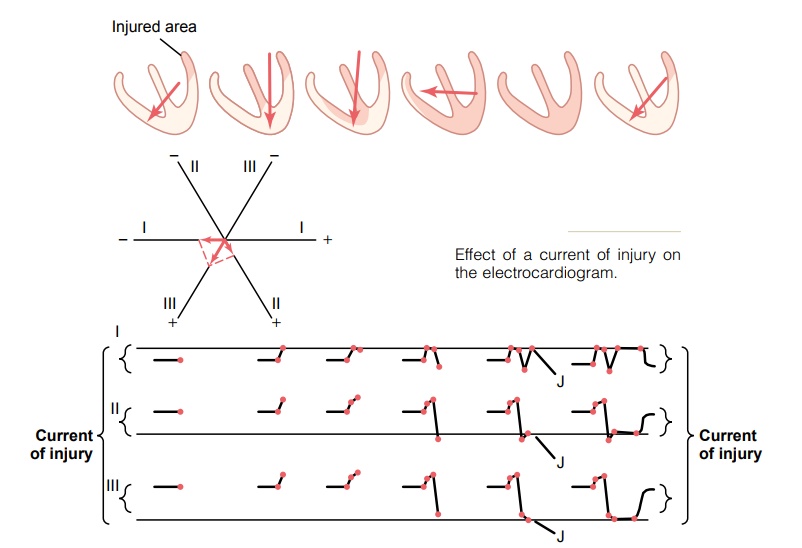
Current of Injury
Many different cardiac abnormalities, especially those that damage the heart muscle itself, often cause part of the heart to remain partially or totally depolarizedall the time. When this occurs, current flows betweenthe pathologically depolarized and the normally polar-ized areas even between heartbeats. This is called a current of injury. Note especially that the injured part of the heart is negative, because this is the part that is depolarized and emits negative charges into the sur-rounding fluids, whereas the remainder of the heart is neutral or positive polarity.
Some abnormalities that can cause current of injury are (1) mechanical trauma, which sometimes makes the membranes remain so permeable that full repo-larization cannot take place; (2) infectious processesthat damage the muscle membranes; and (3) ischemiaof local areas of heart muscle caused by local coronary occlusions, which is by far the most common cause ofcurrent of injury in the heart. During ischemia, not enough nutrients from the coronary blood supply are available to the heart muscle to maintain normal mem-brane polarization.
Effect of Current of Injury on the QRS Complex
In Figure 12–17, a small area in the base of the left ven-tricle is newly infarcted (loss of coronary blood flow). Therefore, during the T-P interval—that is, when the normal ventricular muscle is totally polarized—abnor-mal negative current still flows from the infarcted area at the base of the left ventricle and spreads toward the rest of the ventricles. The vector of this “current of injury,” as shown in the first heart in the figure, is in a direction of about 125 degrees, with the base of the vector, the negative end, toward the injured muscle. As shown in the lower portions of the figure, even before the QRS complex begins, this vector causes an initialrecord in lead I below the zero potential line, becausethe projected vector of the current of injury in lead I points toward the negative end of the lead I axis. In lead II, the record is above the line because the pro-jected vector points more toward the positive terminal of the lead. In lead III, the projected vector points in the same direction as the positive terminal of lead III, so that the record is positive. Furthermore, because the vector lies almost exactly in the direction of the axis of lead III, the voltage of the current of injury in lead III is much greater than in either lead I or lead II.
As the heart then proceeds through its normal process of depolarization, the septum first becomes depolarized; then the depolarization spreads down to the apex and back toward the bases of the ventricles. The last portion of the ventricles to become totally depolarized is the base of the right ventricle, because the base of the left ventricle is already totally and per-manently depolarized. By vectorial analysis, the suc-cessive stages of electrocardiogram generation by the depolarization wave traveling through the ventricles can be constructed graphically, as demonstrated in the lower part of Figure 12–17.
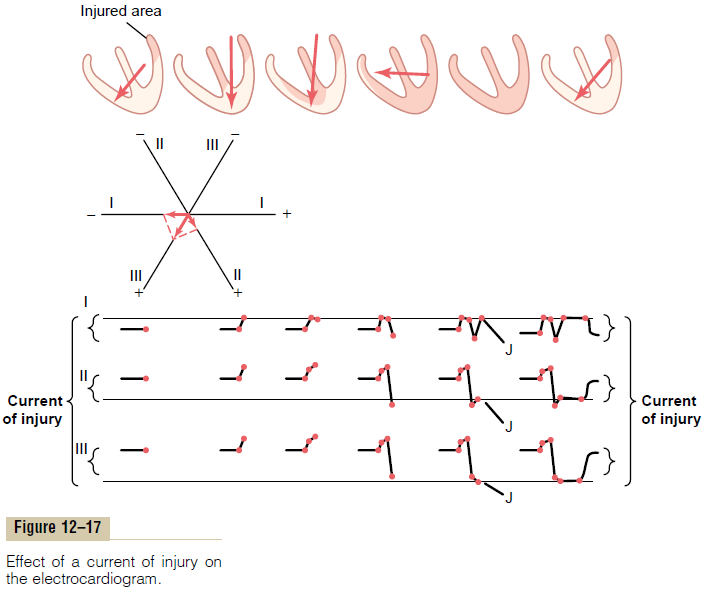
When the heart becomes totally depolarized, at the end of the depolarization process (as noted by the next-to-last stage in Figure 12–17), all the ventricular muscle is in a negative state. Therefore, at this instant in the electrocardiogram, no current flows from the ventricles to the electrocardiographic electrodes because now both the injured heart muscle and the contracting muscle are depolarized.
Next, as repolarization takes place, all of the heart finally repolarizes, except the area of permanent depo-larization in the injured base of the left ventricle. Thus, repolarization causes a return of the current of injury in each lead, as noted at the far right in Figure 12–17.
The J Point—The Zero Reference Potential for Analyzing Current of Injury
One would think that the electrocardiograph machines for recording electrocardiograms could determine when no current is flowing around the heart. However, many stray currents exist in the body, such as currents resulting from “skin potentials” and from differences in ionic concentrations in different fluids of the body. Therefore, when two electrodes are connected between the arms or between an arm and a leg, these stray currents make it impossible for one to predetermine the exact zero reference level in the electrocardiogram. For these reasons, the following procedure must be used to determine the zero poten-tial level: First, one notes the exact point at which thewave of depolarization just completes its passage through the heart, which occurs at the end of the QRScomplex. At exactly this point, all parts of the ventri-cles have become depolarized, including both the damaged parts and the normal parts, so that no current is flowing around the heart. Even the current of injury disappears at this point. Therefore, the potential of the electrocardiogram at this instant is at zero voltage.This point is known as the “J point” in the electrocardio-gram, as shown in Figure 12–18.
Then, for analysis of the electrical axis of the injury potential caused by a current of injury, a horizontal line is drawn in the electrocardiogram for each lead at the level of the J point. This horizontal line is then the zero potential level in the electrocardiogram fromwhich all potentials caused by currents of injury must be measured.
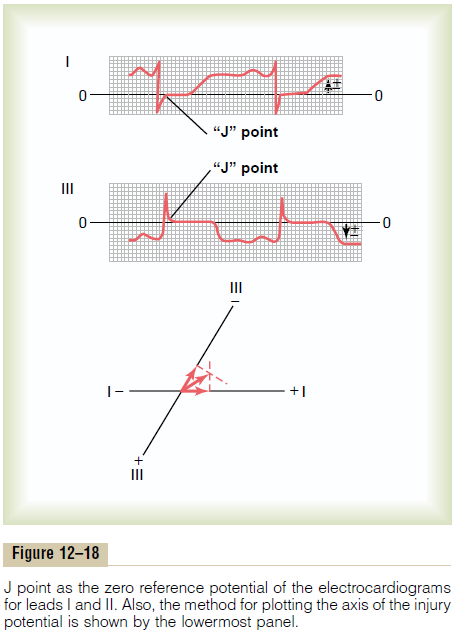
Use of the J Point in Plotting Axis of Injury Potential. Figure12–18 shows electrocardiograms (leads I and III) from an injured heart. Both records show injury potentials. In other words, the J point of each of these two elec-trocardiograms is not on the same line as the T-P segment. In the figure, a horizontal line has been drawn through the J point to represent the zero voltage level in each of the two recordings. The injury potential in each lead is the difference between the voltage of the electrocardiogram immediately before onset of the P wave and the zero voltage level deter-mined from the J point. In lead I, the recorded voltage of the injury potential is above the zero potential level and is, therefore, positive. Conversely, in lead III, the injury potential is below the zero voltage level and, therefore, is negative.
At the bottom in Figure 12–18, the respective injury potentials in leads I and III are plotted on the coordi-nates of these leads, and the resultant vector of the injury potential for the whole ventricular muscle mass is determined by vectorial analysis as described. In this instance, the resultant vector extends from the right side of the ventricles toward the left and slightly upward, with an axis of about -30 degrees. If one places this vector for the injury potential directly over the ventricles, the negative end of the vector pointstoward the permanently depolarized, “injured” area of the ventricles. In the example shown in Figure 12–18,the injured area would be in the lateral wall of the right ventricle.
This analysis is obviously complex. However, it is essential that the student go over it again and again until he or she understands it thoroughly. No other aspect of electrocardiographic analysis is more important.
Coronary Ischemia as a Cause of Injury Potential
Insufficient blood flow to the cardiac muscle depresses the metabolism of the muscle for three reasons: (1) lack of oxygen, (2) excess accumulation of carbon dioxide, and (3) lack of sufficient food nutrients. Consequently, repolarization of the muscle membrane cannot occur in areas of severe myocardial ischemia. Often the heart muscle does not die because the blood flow is sufficient to maintain life of the muscle even though it is not sufficient to cause repolarization of the membranes. As long as this state exists, an injury potential continues to flow during the diastolic portion (the T-P portion) of each heart cycle.
Extreme ischemia of the cardiac muscle occurs after coronary occlusion, and a strong current of injury flows from the infarcted area of the ventricles during the T-P interval between heartbeats, as shown in Figures 12–19 and 12–20. Therefore, one of the most important diagnostic features of electrocardiograms recorded after acute coronary thrombosis is the current of injury.
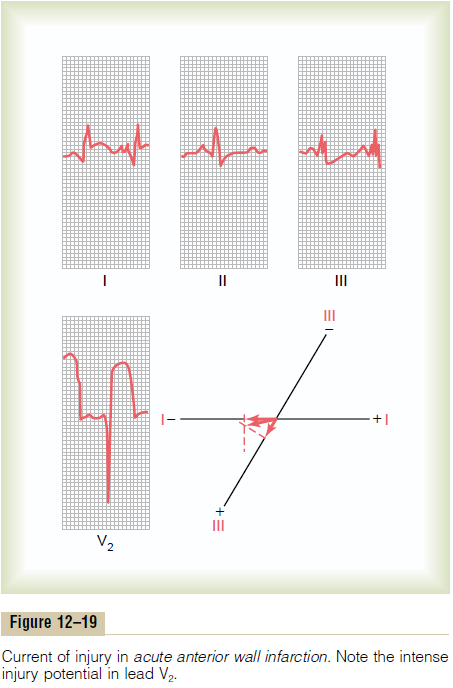
Acute Anterior Wall Infarction. Figure 12–19 shows theelectrocardiogram in the three standard bipolar limb leads and in one chest lead (lead V2 ) recorded from a patient with acute anterior wall cardiac infarction. The most important diagnostic feature of this electrocar-diogram is the intense injury potential in chest lead V2. If one draws a zero horizontal potential line through the J point of this electrocardiogram, a strong negative injury potential during the T-P interval is found, which means that the chest electrode over the front of the heart is in an area of strongly negative potential. In other words, the negative end of the injury potential vector in this heart is against the anterior chest wall. This means that the current of injury is emanating from the anterior wall of the ventricles, which diag-noses this condition as anterior wall infarction.
Analyzing the injury potentials in leads I and III, one finds a negative potential in lead I and a positive potential in lead III. This means that the resultant vector of the injury potential in the heart is about +150 degrees, with the negative end pointing toward the left ventricle and the positive end pointing toward the right ventricle. Thus, in this particular electrocardio-gram, the current of injury is coming mainly from the left ventricle as well as from the anterior wall of the heart. Therefore, one would conclude that this anterior wall infarction almost certainly is caused by thrombo-sis of the anterior descending branch of the left coro-nary artery.
Posterior Wall Infarction. Figure 12–20 shows the threestandard bipolar limb leads and one chest lead (lead V2) from a patient with posterior wall infarction. The major diagnostic feature of this electrocardiogram is
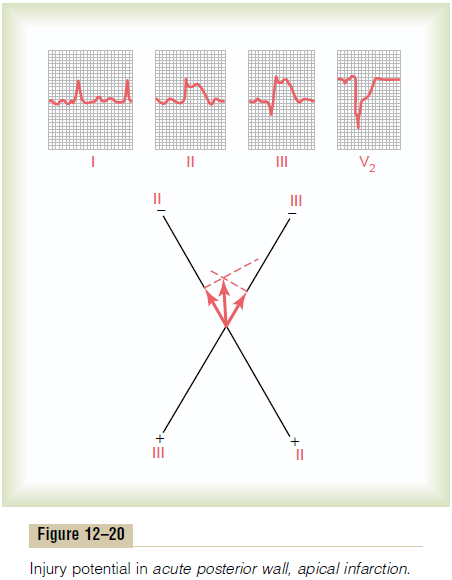
also in the chest lead. If a zero potential reference line is drawn through the J point of this lead, it is readily apparent that during the T-P interval, the potential of the current of injury is positive. This means that the positive end of the vector is in the direction of the anterior chest wall, and the negative end (injured end of the vector) points away from the chest wall. In other words, the current of injury is coming from the back of the heart opposite to the anterior chest wall, which is the reason this type of electrocardiogram is the basis for diagnosing posterior wall infarction.
If one analyzes the injury potentials from leads II and III of Figure 12–20, it is readily apparent that the injury potential is negative in both leads. By vectorial analysis, as shown in the figure, one finds that the resultant vector of the injury potential is about -95 degrees, with the negative end pointing downward and the positive end pointing upward. Thus, because the infarct, as indicated by the chest lead, is on the poste-rior wall of the heart and, as indicated by the injury potentials in leads II and III, is in the apical portion of the heart, one would suspect that this infarct is near the apex on the posterior wall of the left ventricle.
Infarction in Other Parts of the Heart. By the same proce-dures demonstrated in the preceding discussions of anterior and posterior wall infarctions, it is possible to determine the locus of any infarcted area emitting a current of injury, regardless of which part of the heart is involved. In making such vectorial analyses, it must be remembered that the positive end of the injurypotential vector points toward the normal cardiac muscle, and the negative end points toward the injured portion of the heart that is emitting the current of injury.
Recovery from Acute Coronary Thrombosis. Figure 12–21shows a V3 chest lead from a patient with acute pos-terior wall infarction, demonstrating changes in the electrocardiogram from the day of the attack to 1
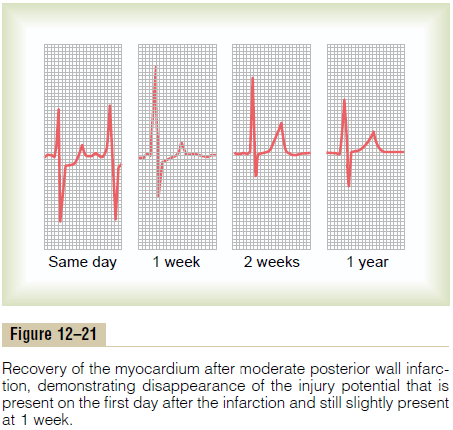
week later, 3 weeks later, and finally 1 year later. From this electrocardiogram, one can see that the injury potential is strong immediately after the acute attack (T-P segment displaced positively from the S-T segment). However, after about 1 week, the injury potential has diminished considerably, and after 3 weeks, it is gone. After that, the electrocardiogram does not change greatly during the next year. This is the usual recovery pattern after acute cardiac infarction of moderate degree, showing that the newcollateral coronary blood flow develops enoughto re-establish appropriate nutrition to most of the infarcted area.
Conversely, in some patients with coronary infarc-tion, the infarcted area never redevelops adequate coronary blood supply. Often, some of the heart muscle dies, but if the muscle does not die, it will con-tinue to show an injury potential as long as the ischemia exists, particularly during bouts of exercise when the heart is overloaded.
Old Recovered Myocardial Infarction. Figure 12–22 showsleads I and III after anterior infarction and leads I and III after posterior infarction about 1 year after the acute heart attack. The records show what might be called the “ideal” configurations of the QRS complex in these types of recovered myocardial infarction. Usually a Q wave has developed at the beginning of the QRS complex in lead I in anterior infarction because of loss of muscle mass in the anterior wall of the left ventricle, but in posterior infarction, a Q wave has developed at the beginning of the QRS complex in lead III because of loss of muscle in the posterior apical part of the ventricle.
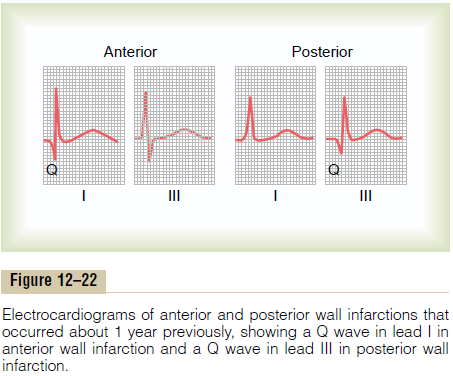
These configurations are certainly not found in all cases of old cardiac infarction. Local loss of muscle and local points of cardiac signal conduction block can cause very bizarre QRS patterns (especially prominent Q waves, for instance), decreased voltage, and QRS prolongation.
Current of Injury in Angina Pectoris. “Angina pectoris”means pain from the heart felt in the pectoral regions of the upper chest. This pain usually also radiates into the left neck area and down the left arm. The pain typ-ically is caused by moderate ischemia of the heart. Usually, no pain is felt as long as the person is quiet, but as soon as he or she overworks the heart, the pain appears.
An injury potential sometimes appears in the elec-trocardiogram during an attack of severe angina pec-toris, because the coronary insufficiency becomes great enough to prevent adequate repolarization of some areas of the heart during diastole.
Related Topics