Chapter: Data Warehousing and Data Mining : Clustering and Applications and Trends in Data Mining
Categorization of Major Clustering Methods
CLUSTER
ANALYSIS
What is Cluster?
Cluster
is a group of objects that belong to the same class.
In other
words the similar object are grouped in one cluster and dissimilar are grouped
in other cluster.
Points to
Remember
o A cluster
of data objects can be treated as a one group.
o While doing
the cluster analysis, the set of data into groups based on data similarity and
then assign the label to the groups.
o The main
advantage of Clustering over classification.
Applications of Cluster Analysis
o Market
research, pattern recognition, data analysis, and image processing.
o Characterize
their customer groups based on purchasing patterns.
o In field
of biology it can be used to derive plant and animal taxonomies, categorize
genes with similar functionality and gain insight into structures inherent in populations.
o Clustering
also helps in identification of areas of similar land use in an earth
observation database. It also helps in the identification of groups of houses
in a city according house type, value, and geographic location.
o Clustering
also helps in classifying documents on the web for information discovery.
o Clustering
is also used in outlier detection applications such as detection of credit card
fraud.
o As a data
mining function Cluster Analysis serve as a tool to gain insight into the distribution
of data to observe characteristics of each cluster.
Requirements of Clustering in
Data Mining
Here are
the typical requirements of clustering in data mining:
o Scalability - We need highly scalable
clustering algorithms to deal with large databases.
o Ability to deal with different kind of attributes -
Algorithms should be capable to be applied
on any kind of data such as interval based (numerical) data, categorical,
binary data.
o Discovery of clusters with attribute shape - The
clustering algorithm should be capable of
detect cluster of arbitrary shape. The should not be bounded to only
distance measures that tend to find spherical cluster of small size.
o High dimensionality - The
clustering algorithm should not only be able to handle low-dimensional data but
also the high dimensional space.
o Ability to deal with noisy data -
Databases contain noisy, missing or erroneous data. Some algorithms are sensitive to such data and may lead to poor quality
clusters.
o Interpretability - The clustering results should
be interpretable, comprehensible and usable.
Clustering Methods
The
clustering methods can be classified into following categories:
o
Kmeans
o
Partitioning Method
o
Hierarchical Method
o
Density-based Method
o
Grid-Based Method
o
Model-Based Method
o
Constraint-based Method
1. K-means
Given k, the k-means algorithm is implemented in four steps:
1.
Partition objects into k nonempty subsets
2.
Compute seed points as the centroids of the
clusters of the current partition (the centroid is the center, i.e., mean point, of the cluster)
3.
Assign each object to the cluster with the nearest
seed point
4.
Go back to Step 2, stop when no more new assignment
2. Partitioning Method
Suppose
we are given a database of n objects, the partitioning method construct k
partition of data.
Each partition
will represent a cluster and k≤n. It means that it will classify the data into
k groups, which satisfy the following requirements:
o Each
group contain at least one object.
o Each
object must belong to exactly one group.
Typical
methods:
K-means,
k-medoids, CLARANS
3
Hierarchical Methods
This
method creates the hierarchical decomposition of the given set of data
objects.:
o Agglomerative
Approach
o Divisive
Approach
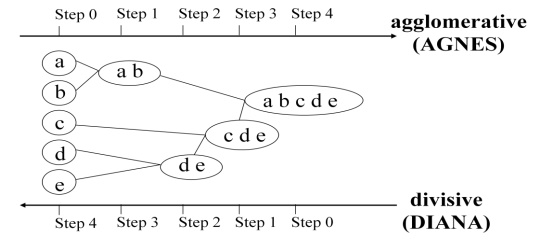
Agglomerative Approach
This
approach is also known as bottom-up approach. In this we start with each object
forming a separate group. It keeps on merging the objects or groups that are
close to one another. It keep on doing so until all of the groups are merged
into one or until the termination condition holds.
Divisive Approach
This
approach is also known as top-down approach. In this we start with all of the
objects in the same cluster. In the continuous iteration, a cluster is split up
into smaller clusters. It is down until each object in one cluster or the
termination condition holds.
Disadvantage
This
method is rigid i.e. once merge or split is done, It can never be undone.
Approaches to improve quality of
Hierarchical clustering
Here is
the two approaches that are used to improve quality of hierarchical clustering:
Perform careful analysis of object linkages at each hierarchical
partitioning.
Integrate hierarchical agglomeration by first using a hierarchical
agglomerative algorithm to
group
objects into microclusters, and then performing macroclustering on the
microclusters. Typical methods: Diana, Agnes, BIRCH, ROCK, CAMELEON
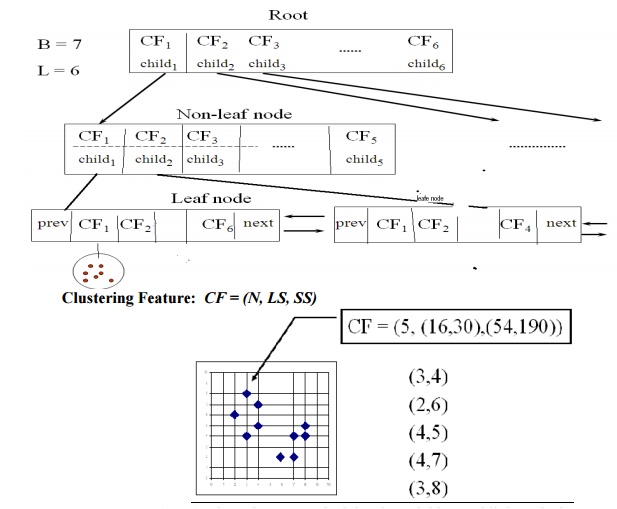
BIRCH
(1996): uses CF-tree and incrementally adjusts the quality of sub-clusters
Incrementally construct a CF (Clustering Feature) tree, a hierarchical
data structure for multiphase clustering
Phase 1: scan DB to build an initial in-memory CF
tree (a multi-level compression of the data that tries to preserve the inherent
clustering structure of the data)
Phase 2: use an arbitrary clustering algorithm to
cluster the leaf nodes of the CF-tree
ROCK
(1999): clustering categorical data by neighbor and link analysis
Robust
Clustering using links
Major ideas
o
Use links to measure similarity/proximity
o
Not distance-based
o
Computational complexity:
Algorithm: sampling-based clustering
o
Draw random sample
o
Cluster with links
o
Label data in disk
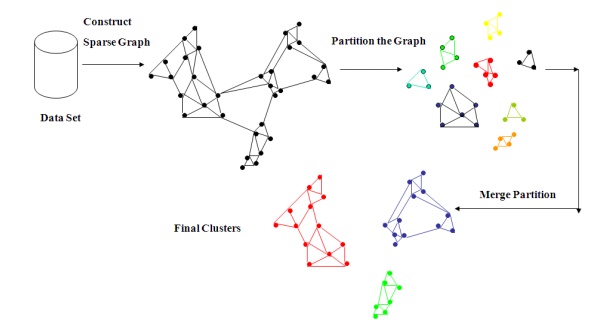
CHAMELEON
(1999): hierarchical clustering using dynamic modeling
· Measures the similarity based on
a dynamic model
o
Two clusters are merged only if the interconnectivity and closeness (proximity) between two
clusters are high relative to the
internal interconnectivity of the clusters and closeness of items within the
clusters
o
Cure ignores
information about interconnectivity of
the objects, Rock ignores information about the closeness of two clusters
A two-phase algorithm
Use a graph partitioning algorithm: cluster objects
into a large number of relatively small sub-clusters
o
Use an agglomerative hierarchical clustering
algorithm: find the genuine clusters by repeatedly combining these sub-clusters
4
Density-based Method
Clustering based on density
(local cluster criterion), such as density-connected points
Major features:
o
Discover clusters of arbitrary shape
o
Handle noise
o
One scan
o
Need density parameters as termination condition
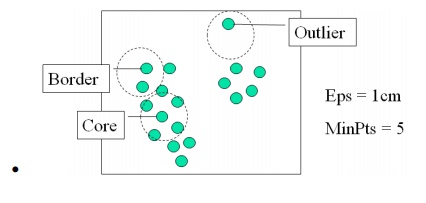
Two parameters:
o
Eps: Maximum
radius of the neighbourhood
o
MinPts: Minimum
number of points in an Eps-neighbourhood of that point
Typical methods: DBSACN, OPTICS, DenClue
DBSCAN: Density Based Spatial Clustering of Applications with Noise
Relies on a density-based
notion of cluster: A cluster is
defined as a maximal set of density-connected points
Discovers clusters of arbitrary shape in spatial databases with noise
DBSCAN: The Algorithm
Arbitrary select a point p
Retrieve all points density-reachable from p w.r.t. Eps and MinPts.
If p is a core point, a
cluster is formed.
If p is a border point, no
points are density-reachable from p
and DBSCAN visits the next point of the database.
Continue the process until all of the points have been processed.
o
OPTICS: Ordering Points To Identify the Clustering
Structure
o
Produces a special order of the database with its
density-based clustering structure
o
This cluster-ordering contains info equiv to the density-based
clustering’s corresponding to a broad range of parameter settings
o
Good for both automatic and interactive cluster
analysis, including finding intrinsic clustering structure
o
Can be represented graphically or using
visualization techniques
DENCLUE: DENsity-based CLUstEring
Major features
o
Solid mathematical foundation
o
Good for data sets with large amounts of noise
o
Allows a compact mathematical description of
arbitrarily shaped clusters in high-dimensional data sets
o
Significant faster than existing algorithm (e.g.,
DBSCAN)
o
But needs a large number of parameters
5. Grid-based Method
Using
multi-resolution grid data structure
Advantage
o The major
advantage of this method is fast processing time.
o It is
dependent only on the number of cells in each dimension in the quantized space.
o Typical
methods: STING, WaveCluster, CLIQUE
o STING: a
STatistical INformation Grid approach
o The
spatial area area is divided into rectangular cells
o
There are several levels of cells corresponding to
different levels of resolution
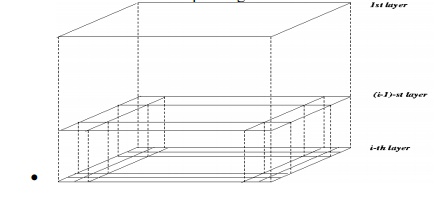
o
Each cell at a high level is partitioned into a
number of smaller cells in the next lower level
o
Statistical info of each cell is calculated and
stored beforehand and is used to answer queries
o
Parameters of higher level cells can be easily
calculated from parameters of lower level cell
count, mean, s, min, max
type of distribution—normal, uniform, etc.
o
Use a top-down approach to answer spatial data
queries
o
Start from a pre-selected layer—typically with a
small number of cells
o
For each cell in the current level compute the
confidence interval
·
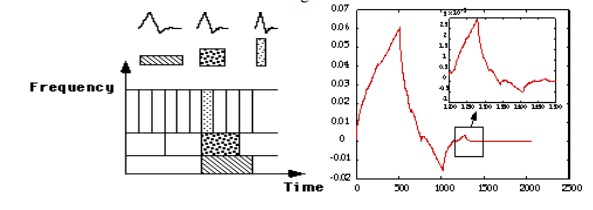
WaveCluster: Clustering by Wavelet Analysis
·
A multi-resolution clustering approach which
applies wavelet transform to the feature space
·
How to apply wavelet transform to find clusters
o
Summarizes the data by imposing a multidimensional
grid structure onto data space
o
These multidimensional spatial data objects are
represented in a n-dimensional feature space
o
Apply wavelet transform on feature space to find
the dense regions in the feature space
o
Apply wavelet transform multiple times which result
in clusters at different scales from fine to coarse
·
Wavelet transform: A signal processing technique
that decomposes a signal into different frequency sub-band (can be applied to
n-dimensional signals)
·
Data are transformed to preserve relative distance
between objects at different levels of resolution
·
Allows natural clusters to become more
distinguishable
6
Model-based methods
·
Attempt
to optimize the fit between the given data and some mathematical model
·
Based on
the assumption: Data are generated by a mixture of underlying probability
distribution
o In this
method a model is hypothesize for each cluster and find the best fit of data to
the given model.
o This
method also serve a way of automatically determining number of clusters based
on standard statistics, taking outlier or noise into account. It therefore
yields robust clustering methods.
o Typical
methods: EM, SOM, COBWEB
o EM — A
popular iterative refinement algorithm
o An
extension to k-means
Assign each object to a cluster according to a
weight (prob. distribution)
New means are computed based on weighted measures
o General
idea
Starts with an initial estimate of the parameter
vector
Iteratively rescores the patterns against the
mixture density produced by the parameter vector
The rescored patterns are used to update the
parameter updates
Patterns belonging to the same cluster, if they are
placed by their scores in a particular component
o Algorithm
converges fast but may not be in global optima
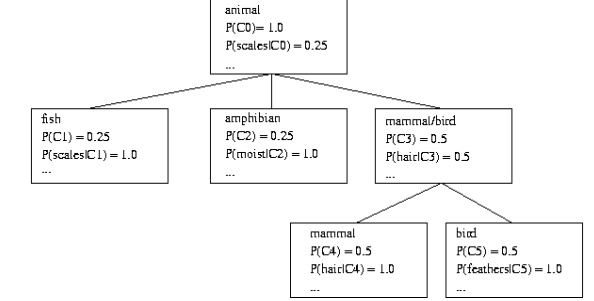
o COBWEB
(Fisher’87)
A popular a simple method of incremental conceptual
learning
Creates a hierarchical clustering in the form of a
classification tree
Each node
refers to a concept and contains a probabilistic description of that concept
o
SOM (Soft-Organizing feature Map)
o
Competitive learning
o
Involves a hierarchical architecture of several
units (neurons)
o
Neurons compete in a ―winner-takes-all‖ fashion for
the object currently being presented
o SOMs,
also called topological ordered maps, or Kohonen Self-Organizing Feature Map
(KSOMs)
o It maps
all the points in a high-dimensional source space into a 2 to 3-d target space,
s.t., the distance and proximity relationship (i.e., topology) are preserved as
much as possible
o
Similar to k-means: cluster centers tend to lie in
a low-dimensional manifold in the feature space
o Clustering
is performed by having several units competing for the current object
·
The unit whose weight vector is closest to the current
object wins
·
The winner and its neighbors learn by having their
weights adjusted
o SOMs are
believed to resemble processing that can occur in the brain
o Useful
for visualizing high-dimensional data in 2- or 3-D space
7
Constraint-based Method
o Clustering
by considering user-specified or application-specific constraints
o Typical
methods: COD (obstacles), constrained clustering
o Need user
feedback: Users know their applications the best
o Less
parameters but more user-desired constraints, e.g., an ATM allocation problem:
obstacle & desired clusters
o Clustering
in applications: desirable to have user-guided (i.e., constrained) cluster
analysis
o Different
constraints in cluster analysis:
Constraints on individual objects (do selection
first)
Cluster on houses worth over $300K o Constraints on distance or
similarity functions
Weighted functions, obstacles (e.g., rivers, lakes)
o Constraints
on the selection of clustering parameters
# of clusters, MinPts, etc. o User-specified constraints
Contain at least 500 valued customers and 5000
ordinary ones o
Semi-supervised:
giving small training sets as ―constraints‖ or hints
o Example:
Locating k delivery centers, each serving at least m valued customers and n
ordinary ones
o Proposed
approach
Find an initial ―solution‖ by partitioning the data
set into k groups and satisfying user-constraints
Iteratively refine the solution by micro-clustering
relocation (e.g., moving δ μ-clusters from cluster Ci to Cj)
and ―deadlock‖ handling (break the microclusters when necessary)
Efficiency is improved by micro-clustering
o
How to handle more complicated constraints?
E.g., having approximately same number of valued
customers in each cluster?! — Can you solve it?
Related Topics