Chapter: Business Science : Security Analysis and Portfolio Management : Fundamental Analysis
Applied Valuation Techniques
APPLIED
VALUATION TECHNIQUES:
Although the raw data
of the Financial Statement has some useful information, much more can be
understood about the value of a stock by applying a variety of tools to the
financial data.
2. Price to
Earnings Ratio P/E
3. Projected
Earnings Growth PEG
5. Price to
Book P/B
7. Dividend Yield
8. Book Value
per share
9. Return on
Equity
1. Earnings per Share
The overall
earnings of a company is not in itself a useful indicator of a stock's worth.
Low earnings
coupled with low outstanding shares can be more valuable than high earnings
with a high number of outstanding shares. Earnings per share is much more useful
information than earnings by itself. Earnings per share (EPS) is calculated by
dividing the net earnings by the number of outstanding shares.
EPS
= Net Earnings / Outstanding Shares
For example: ABC company had net earnings of $1
million and 100,000 outstanding shares for an EPS of 10 (1,000,000 / 100,000 =
10). This information is useful for comparing two companies in a certain
industry but should not be the deciding factor when choosing stocks.
2.Price to Earnings Ratio
The Price to Earnings
Ratio (P/E) shows the relationship between stock price and company earnings. It
is calculated by dividing the share price by the Earnings per Share.
P/E
= Stock Price / EPS
In our example above of
ABC company the EPS is 10 so if it has a price per share of $50 the P/E is 5
(50 / 10 = 5). The P/E tells you how many investors are willing to pay for that
particular company's earnings. P/E's can be read in a variety of ways. A high
P/E could mean that the company is overpriced or it could mean that investors expect
the company to continue to grow and generate profits. A low P/E could mean that
investors are wary of the company or it could indicate a company that most
investors have overlooked.
Either way, further analysis is needed to determine
the true value of a particular stock.
3. Projected
Earnings Growth Rate-PEG Ratio
A ratio used to determine a stock's value while
taking into account earnings growth. The calculation is as follows:
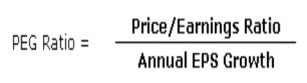
PEG is a widely used indicator of a
stock's potential value. It is favoured by many over the price/earnings ratio
because it also accounts for growth. Similar to the P/E ratio, a lower PEG
means that the stock is more undervalued.
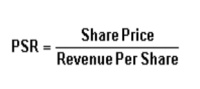
4. Price to Sales Ratio
When a company has no earnings, there
are other tools available to help investors judge its worth. New companies in
particular often have no earnings, but that does not mean they are bad
investments. The Price to Sales ratio (P/S) is a useful tool for judging new
companies. It is calculated by dividing the market cap (stock price times
number of outstanding shares) by total revenues. An alternate method is to
divide current share price by sales per share. P/S indicates the value the
market places on sales. The lower the P/S the better the value.
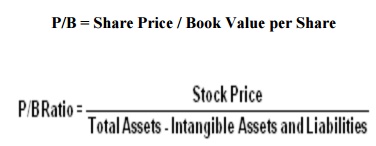
5.Price to Book Ratio
Book value
is determined by subtracting liabilities from assets. The value of a growing
company will
always be more than book value because of the potential for future revenue. The
price to book ratio (P/B) is the value the market places on the book value of
the company. It is calculated by dividing the current price per share by the
book value per share (book value / number of outstanding shares). It is also
known as the "price-equity ratio".
P/B = Share Price / Book Value per Share
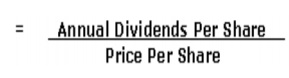
6. Dividend Yield
Some investors are looking for stocks that can
maximize dividend income. Dividend yield is useful for determining the
percentage return a company pays in the form of dividends. It is calculated by
dividing the annual dividend per share by the stock's price per share. Usually
it is the older, well-established companies that pay a higher percentage, and
these companies also usually have a more consistent dividend history than
younger companies. Dividend yield is calculated as follows:
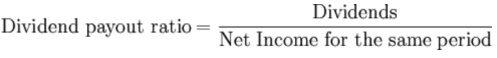
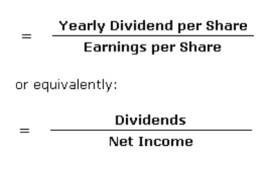
7. Dividend payout ratio
Dividend payout ratio is the fraction of net income a firm pays to its stockholders in
dividends:
The part of
the earnings not paid to investors is left for investment to provide for future
earnings growth. Investors seeking high current income and limited capital
growth prefer companies with high Dividend payout ratio. However investors
seeking capital growth may prefer lower payout ratio because capital gains are
taxed at a lower rate. High growth firms in early life generally have low or
zero payout ratios. As they mature, they tend to return more of the earnings
back to investors. Note that dividend payout ratio is calculated as EPS/DPS.
Calculated as:
The payout ratio provides an idea of how
well earnings support the dividend payments. More mature companies tend to have
a higher payout ratio. In the U.K. there is a similar ratio, which is known as
dividend cover. It is calculated as earnings per share divided by dividends per
share.
8. Return on Equity
Return on
equity (ROE) is a measure of how much, in
earnings a company generates in a time period compared to its
shareholders' equity. It is typically calculated on a full-year basis (either
the last fiscal year or the last four quarters).
Expanded Definition
When
capital is tied up in a business, the owners of the capital want to see a good
return on that capital. Looking at profit by itself is meaningless. I mean, if
a company earns $1 million in net income, that's okay. But its great if the
capital invested to earn that is only $2.5 million (40% return) and terrible if
the capital invested is $25 million (4% return).
Return on investment measures how
profitable the company is for the owner of the investment. In this case, return
on equity measures how profitable the company is for the equity owners,
a.k.a. the shareholders.
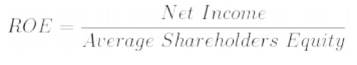
The "average" is taken over
the time period being calculated and is equal to "the sum of the beginning
equity balance and the ending equity balance, divided by two."
9.Book Value per Share
A measure used by owners of common
shares in a firm to determine the level of safety associated with each
individual share after all debts are paid accordingly.
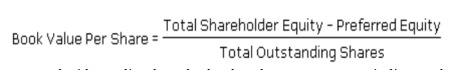
Should the company decide to dissolve,
the book value per common indicates the dollar value remaining for common
shareholders after all assets are liquidated and all debtors are paid. In
simple terms it would be the amount of money that a holder of a common share would
get if a company were to liquidate.
Grahm and Dodds Investor
ratios:
Eg.,
Earnings per share=
Earnings available for the common shares
/ Weighted average common shares outstanding
Related Topics