Chapter: Medical Physiology: Electrocardiographic Interpretation of Cardiac Muscle and Coronary Blood Flow Abnormalities: Vectorial Analysis
Vectorial Analysis of the Normal Electrocardiogram
Vectorial Analysis of the Normal Electrocardiogram
Vectors That Occur at Successive Intervals During Depolarization of the Ventricles—The QRS Complex
When the cardiac impulse enters the ventricles through the atrioventricular bundle, the first part of the ventricles to become depolarized is the left endo-cardial surface of the septum. Then depolarization spreads rapidly to involve both endocardial surfaces of the septum, as demonstrated by the shaded portion of the ventricle in Figure 12–7A. Next, depolarization spreads along the endocardial surfaces of the remain-der of the two ventricles, as shown in Figure 12–7B and C. Finally, it spreads through the ventricular muscle tothe outside of the heart, as shown progressively in Figure 12–7C, D, and E.
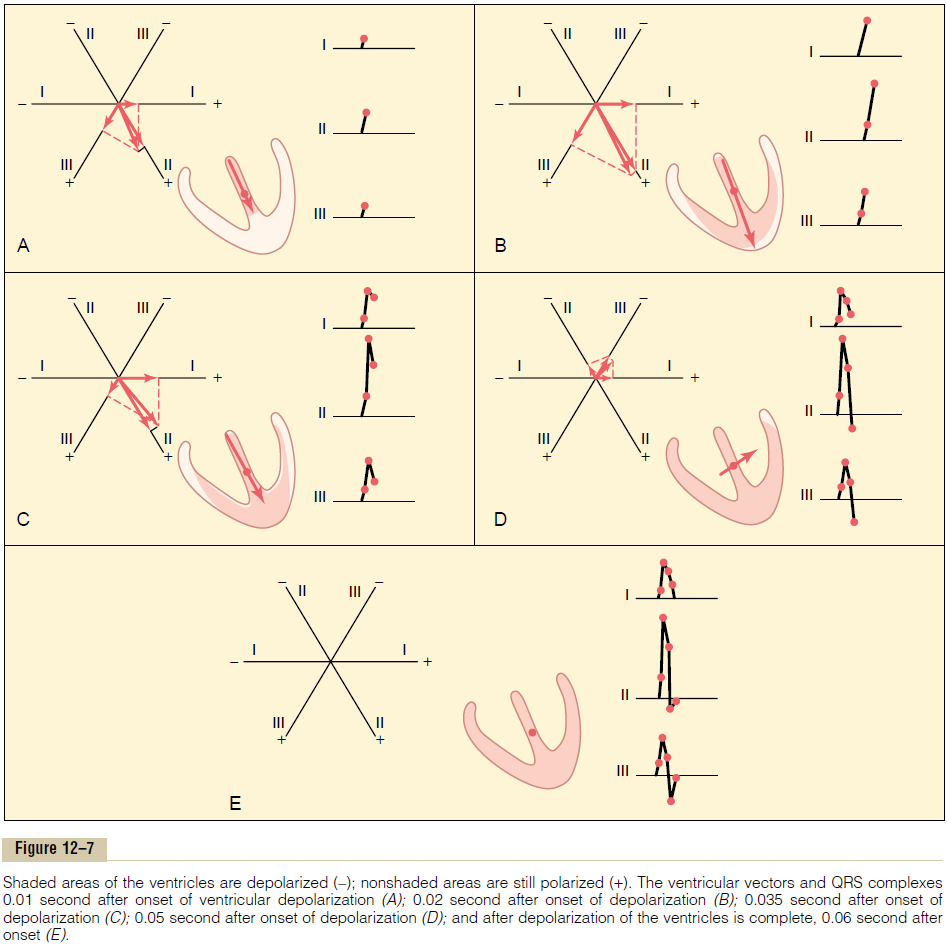
At each stage in Figure 12–7, parts A to E, the instantaneous mean electrical potential of the ventri-cles is represented by a red vector superimposed on the ventricle in each figure. Each of these vectors is then analyzed by the method described in the preced-ing section to determine the voltages that will be recorded at each instant in each of the three standard electrocardiographic leads. To the right in each figure is shown progressive development of the electrocar-diographic QRS complex. Keep in mind that a positivevector in a lead will cause recording in the electrocar-diogram above the zero line, whereas a negative vector will cause recording below the zero line.
Before proceeding with further consideration of vectorial analysis, it is essential that this analysis of the successive normal vectors presented in Figure 12–7 be understood. Each of these analyses should be studied in detail by the procedure given here. A short summary of this sequence follows.
In Figure 12–7A, the ventricular muscle has just begun to be depolarized, representing an instant about 0.01 second after the onset of depolarization. At this time, the vector is short because only a small portion of the ventricles—the septum—is depolarized. There-fore, all electrocardiographic voltages are low, as recorded to the right of the ventricular muscle for each of the leads. The voltage in lead II is greater than the voltages in leads I and III because the heart vector extends mainly in the same direction as the axis of lead II.
In Figure 12–7B, which represents about 0.02 second after onset of depolarization, the heart vector is long because much of the ventricular muscle mass has become depolarized. Therefore, the voltages in all electrocardiographic leads have increased.
In Figure 12–7C, about 0.035 second after onset of depolarization, the heart vector is becoming shorter and the recorded electrocardiographic voltages are lower because the outside of the heart apex is now electronegative, neutralizing much of the positivity on the other epicardial surfaces of the heart. Also, the axis of the vector is beginning to shift toward the left side of the chest because the left ventricle is slightly slower to depolarize than the right. Therefore, the ratio of the voltage in lead I to that in lead III is increasing.
In Figure 12–7D, about 0.05 second after onset of depolarization, the heart vector points toward the base of the left ventricle, and it is short because only a minute portion of the ventricular muscle is still polar-ized positive. Because of the direction of the vector at this time, the voltages recorded in leads II and III are both negative—that is, below the line—whereas the voltage of lead I is still positive.
In Figure 12–7E, about 0.06 second after onset of depolarization, the entire ventricular muscle mass is depolarized, so that no current flows around the heart and no electrical potential is generated. The vector becomes zero, and the voltages in all leads become zero.
Thus, the QRS complexes are completed in the three standard bipolar limb leads.
Sometimes the QRS complex has a slight negative depression at its beginning in one or more of the leads, which is not shown in Figure 12–7; this depression is the Q wave. When it occurs, it is caused by initial depo-larization of the left side of the septum before the right side, which creates a weak vector from left to right for a fraction of a second before the usual base-to-apex vector occurs. The major positive deflection shown in Figure 12–7 is the R wave, and the final negative deflection is the S wave.
Electrocardiogram During Repolarization—The T Wave
After the ventricular muscle has become depolarized, about 0.15 second later, repolarization begins and proceeds until complete at about 0.35 second.This repo-larization causes the T wave in the electrocardiogram.
Because the septum and endocardial areas of the ventricular muscle depolarize first, it seems logical that these areas should repolarize first as well. However, this is not the usual case because the septum and other endocardial areas have a longer period of contraction than most of the external surfaces of the heart. There-fore, the greatest portion of ventricular muscle mass torepolarize first is the entire outer surface of the ventri-cles, especially near the apex of the heart. The endocar-dial areas, conversely, normally repolarize last. This sequence of repolarization is postulated to be caused by the high blood pressure inside the ventricles during contraction, which greatly reduces coronary blood flow to the endocardium, thereby slowing repolariza-tion in the endocardial areas.
Because the outer apical surfaces of the ventricles repolarize before the inner surfaces, the positive end of the overall ventricular vector during repolarization is toward the apex of the heart. As a result, the normalT wave in all three bipolar limb leads is positive, which is also the polarity of most of the normal QRS complex.
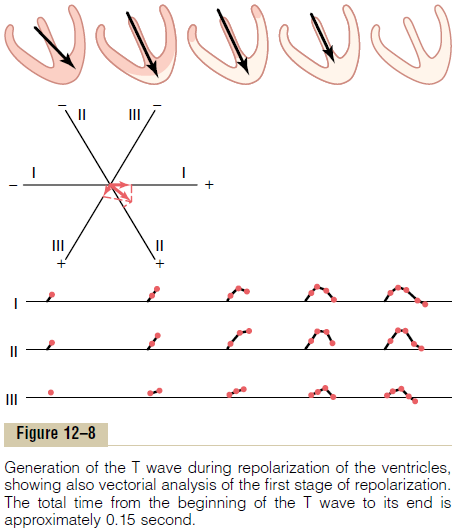
In Figure 12–8, five stages of repolarization of the ventricles are denoted by progressive increase of the white areas—the repolarized areas. At each stage, the vector extends from the base of the heart toward the apex until it disappears in the last stage. At first, the vector is relatively small because the area of repolarization is small. Later, the vector becomes stronger because of greater degrees of repolarization.
Finally, the vector becomes weaker again because the areas of depolarization still persisting become so slight that the total quantity of current flow decreases. These changes also demonstrate that the vector is greatest when about half the heart is in the polarized state and about half is depolarized.
The changes in the electrocardiograms of the three standard limb leads during repolarization are noted under each of the ventricles, depicting the progressive stages of repolarization. Thus, over about 0.15 second, the period of time required for the whole process to take place, the T wave of the electrocardiogram is generated.
Depolarization of the Atria— The P Wave
Depolarization of the atria begins in the sinus node and spreads in all directions over the atria. Therefore, the point of original electronegativity in the atria is about at the point of entry of the superior vena cava where the sinus node lies, and the direction of initial depolarization is denoted by the black vector in Figure 12–9. Furthermore, the vector remains generally in this direction throughout the process of normal atrial depolarization. Because this direction is generally in the positive directions of the axes of the three standard bipolar limb leads I, II, and III, the electro-cardiograms recorded from the atria during depolar-ization are also usually positive in all three of these leads, as shown in Figure 12–9. This record of atrial depolarization is known as the atrial P wave.
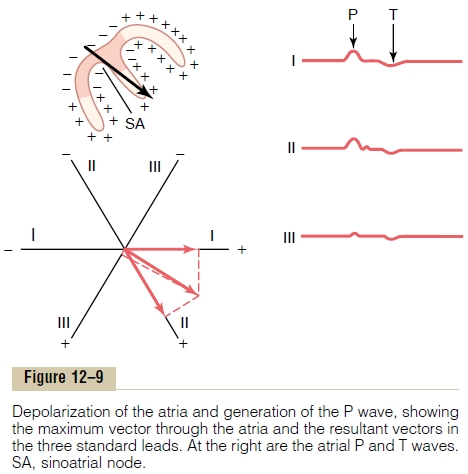
Repolarization of the Atria—The Atrial T Wave. Spread ofdepolarization through the atrial muscle is muchslower than in the ventricles because the atria have noPurkinje system for fast conduction of the depolariza-tion signal. Therefore, the musculature around the sinus node becomes depolarized a long time before the musculature in distal parts of the atria. Because of this, the area in the atria that also becomes repolarized first is the sinus nodal region, the area that had originally become depolarized first. Thus, when repolarizationbegins, the region around the sinus node becomes pos-itive with respect to the rest of the atria. Therefore, the atrial repolarization vector is backward to the vector ofdepolarization. (Note that this is opposite to the effectthat occurs in the ventricles.) Therefore, as shown to the right in Figure 12–9, the so-called atrial T wave follows about 0.15 second after the atrial P wave, but this T wave is on the opposite side of the zero refer-ence line from the P wave; that is, it is normally nega-tive rather than positive in the three standard bipolar limb leads.
In the normal electrocardiogram, the atrial T wave appears at about the same time that the QRS complex of the ventricles appears. Therefore, it is almost always totally obscured by the large ventricular QRS complex, although in some very abnormal states, it does appear in the recorded electrocardiogram.
Vectorcardiogram
It has been noted in the discussion up to this point that the vector of current flow through the heart changes rapidly as the impulse spreads through the myocardium. It changes in two aspects: First, the vector increases and decreases in length because of increasing and decreasing voltage of the vector.
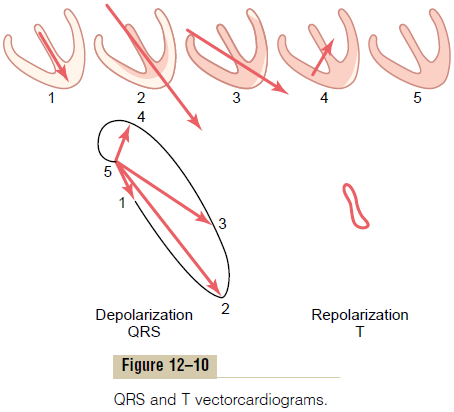
Second, the vector changes direction because of changes in the average direction of the electrical potential from the heart. The so-called vectorcardio-gram depicts these changes at different times duringthe cardiac cycle, as shown in Figure 12–10.
In the large vectorcardiogram of Figure 12–10, point 5 is the zero reference point, and this point is the neg-ative end of all the successive vectors. While the heart muscle is polarized between heartbeats, the positive end of the vector remains at the zero point because there is no vectorial electrical potential. However, as soon as current begins to flow through the ventri-cles at the beginning of ventricular depolarization, the positive end of the vector leaves the zero reference point.
When the septum first becomes depolarized, the vector extends downward toward the apex of the ven-tricles, but it is relatively weak, thus generating the first portion of the ventricular vectorcardiogram, as shown by the positive end of vector 1. As more of the ventricular muscle becomes depolarized, the vector becomes stronger and stronger, usually swinging slightly to one side. Thus, vector 2 of Figure 12–10 rep-resents the state of depolarization of the ventricles about 0.02 second after vector 1. After another 0.02 second, vector 3 represents the potential, and vector 4 occurs in another 0.01 second. Finally, the ventricles become totally depolarized, and the vector becomes zero once again, as shown at point 5.
The elliptical figure generated by the positive ends of the vectors is called the QRS vectorcardiogram. Vectorcardiograms can be recorded on an oscilloscope by connecting body surface electrodes from the neck and lower abdomen to the vertical plates of the oscil-loscope and connecting chest surface electrodes from each side of the heart to the horizontal plates. When the vector changes, the spot of light on the oscilloscope follows the course of the positive end of the changing vector, thus inscribing the vectorcardiogram on the oscilloscopic screen.
Related Topics