Chapter: Software Design : Structured System Analysis and Design
Software Design: Transform Analysis
Transform Analysis
Transform
analysis is strategy of converting each piece of DFD (may be from level 2 or
level 3, etc.) for all the identified transaction centers. Draw a DFD of a
transaction type (usually done during analysis phase)
·
Find the central functions of the DFD
·
Convert the DFD into a first-cut structure chart
·
Refine the structure chart
· Verify that the final structure chart meets the requirements of the original DFD Let us understand these steps through a payroll system example:
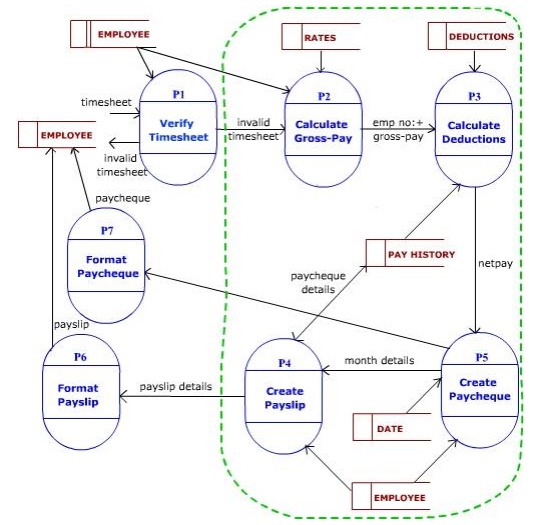
The
central transform is the portion of DFD that contains the essential functions
of the system and is independent of the particular implementation of the input
and output. One way of identifying central transform (Page-Jones, 1988) is to
identify the centre of the DFD by pruning off its afferent and efferent
branches. Afferent stream is traced from outside of the DFD to a flow point
inside, just before the input is being transformed into some form of output
(For example, a format or validation process only refines the input – does not
transform it). Similarly an efferent stream is a flow point from where output
is formatted for better presentation. The processes between afferent and
efferent stream represent the central transform (marked within dotted lines
above). In the above example, P1 is an input process, and P6 & P7 are
output processes. Central transform processes are P2, P3, P4 & P5 - which
transform the given input into some form of output.
First-cut Structure Chart
To
produce first-cut (first draft) structure chart, first we have to establish a
boss module. A boss module can be one of the central transform processes.
Ideally, such process has to be more of a coordinating process (encompassing
the essence of transformation). In case we fail to find a boss module within, a
dummy coordinating module is created
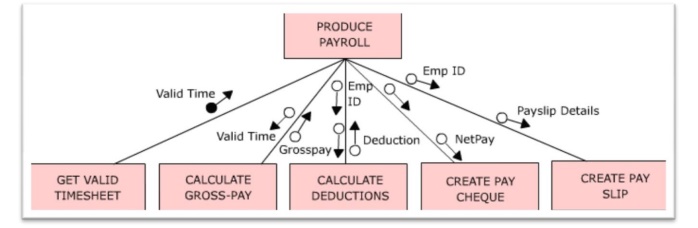
In the
above illustration, we have a dummy boss module ―Produce Payroll‖ – which is
named in a way that it indicate what the program is about. Having established
the boss module, the afferent stream processes are moved to left most side of
the next level of structure chart; the efferent stream process on the right
most side and the central transform processes in the middle. Here, we moved a
module to get valid timesheet (afferent process) to the left side (indicated in
yellow). The two central transform processes are move in the middle (indicated
in orange). By grouping the other two central transform processes with the
respective efferent processes, we have created two modules (in blue) –
essentially to print results, on the right side.
The main
advantage of hierarchical (functional) arrangement of module is that it leads
to flexibility in the software. For instance, if ―Calculate Deduction‖ module
is to select deduction rates from multiple rates, the module can be split into
two in the next level – one to get the selection and another to calculate. Even
after this change, the ―Calculate Deduction‖ module would return the same
value.
·
Refine
the Structure Chart
Expand the structure chart further by using the
different levels of DFD. Factor down till you reach to modules that correspond
to processes that access source / sink or data stores. Once this is ready,
other features of the software like error handling, security, etc. has to be
added. A module name should not be used for two different modules. If the same
module is to be used in more than one place, it will be demoted down such that
―fan in‖ can be done from the higher levels. Ideally, the name should sum up
the activities done by the module and its sub-ordinates.
·
Verify
Structure Chart vis-à-vis with DFD
Because of the orientation towards the end-product,
the software, the finer details of how data gets originated and stored (as
appeared in DFD) is not explicit in Structure Chart. Hence DFD may still be
needed along with Structure Chart to understand the data flow while creating
low-level design.
·
check the list of properties for transform flow
characteristics
·
be aware that this is a guideline only
·
Step 2b:
·
find and mark the center of transformation in the
DFD
·
locate the center of transformation
·
follow input-driven flows into the center until the
data is in an internal format, correct and complete ===> mark position
·
trace back output-driven flows to the center until
the data is complete and ready for presentation, but not yet in external format
===> mark position
·
connect all markings: center of transformation
·
add data (and control) flows
·
further decompose (factor) were necessary
·
user interface handling modules
·
error-handling modules
·
add initialisation & termination modules
·
check quality of design:
·
cohesion
·
coupling
·
reconfirm mapping with DFD
Related Topics