Chapter: Medical Physiology: Electrocardiographic Interpretation of Cardiac Muscle and Coronary Blood Flow Abnormalities: Vectorial Analysis
Mean Electrical Axis of the Ventricular QRS - And Its Significance
Mean Electrical Axis of the Ventricular QRS— And Its Significance
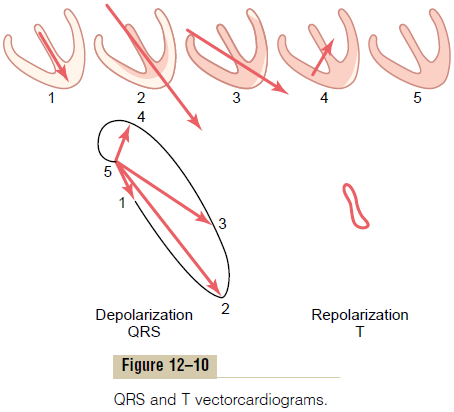
The vectorcardiogram during ventricular depolariza-tion (the QRS vectorcardiogram) shown in Figure 12–10 is that of a normal heart. Note from this vec-torcardiogram that the preponderant direction of the vectors of the ventricles during depolarization is mainly toward the apex of the heart. That is, during most of the cycle of ventricular depolarization, the direction of the electrical potential (negative to posi-tive) is from the base of the ventricles toward the apex. This preponderant direction of the potential during depolarization is called the mean electrical axis of theventricles. The mean electrical axis of the normalventricles is 59 degrees. In many pathological condi-tions of the heart, this direction changes markedly— sometimes even to opposite poles of the heart.
Determining the Electrical Axis from Standard Lead Electrocardiograms
Clinically, the electrical axis of the heart usually is esti-mated from the standard bipolar limb lead electrocar-diograms rather than from the vectorcardiogram. Figure 12–11 shows a method for doing this. After recording the standard leads, one determines the net potential and polarity of the recordings in leads I and III. In lead I of Figure 12–11, the recording is positive, and in lead III, the recording is mainly positive but negative during part of the cycle. If any part of a recording is negative, this negative potential is sub-tracted from the positive part of the potential to deter-mine the net potential for that lead, as shown by the arrow to the right of the QRS complex for lead III.
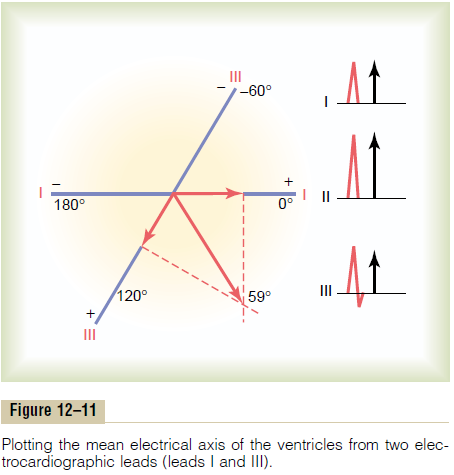
Then each net potential for leads I and III is plotted on the axes of the respective leads, with the base of the potential at the point of intersection of the axes, as shown in Figure 12–11.
If the net potential of lead I is positive, it is plotted in a positive direction along the line depicting lead I. Conversely, if this potential is negative, it is plotted in a negative direction. Also, for lead III, the net poten-tial is placed with its base at the point of intersection, and, if positive, it is plotted in the positive direction along the line depicting lead III. If it is negative, it is plotted in the negative direction.
To determine the vector of the total QRS ventricu-lar mean electrical potential, one draws perpendicular lines (the dashed lines in the figure) from the apices of leads I and III, respectively. The point of intersection of these two perpendicular lines represents, by vecto-rial analysis, the apex of the mean QRS vector in the ventricles, and the point of intersection of the lead I and lead III axes represents the negative end of the mean vector. Therefore, the mean QRS vector is drawn between these two points. The approximate average potential generated by the ventricles during depolar-ization is represented by the length of this mean QRS vector, and the mean electrical axis is represented by the direction of the mean vector. Thus, the orientation of the mean electrical axis of the normal ventricles, as determined in Figure 12–11, is 59 degrees positive (+59 degrees).
Abnormal Ventricular Conditions That Cause Axis Deviation
Although the mean electrical axis of the ventricles averages about 59 degrees, this axis can swing even in the normal heart from about 20 degrees to about 100 degrees. The causes of the normal variations are mainly anatomical differences in the Purkinje distri-bution system or in the musculature itself of different hearts. However, a number of abnormal conditions of the heart can cause axis deviation beyond the normal limits, as follows.
Change in the Position of the Heart in the Chest. If the heartitself is angulated to the left, the mean electrical axis of the heart also shifts to the left. Such shift occurs (1) at the end of deep expiration, (2) when a person lies down, because the abdominal contents press upward against the diaphragm, and (3) quite frequently in stocky, fat people whose diaphragms normally press upward against the heart all the time.
Likewise, angulation of the heart to the right causes the mean electrical axis of the ventricles to shift to theright. This occurs (1) at the end of deep inspiration, (2) when a person stands up, and (3) normally in tall, lanky people whose hearts hang downward.
Hypertrophy of One Ventricle. When one ventricle greatlyhypertrophies, the axis of the heart shifts toward thehypertrophied ventricle for two reasons. First, a fargreater quantity of muscle exists on the hypertrophied side of the heart than on the other side, and this allows excess generation of electrical potential on that side. Second, more time is required for the depolarization wave to travel through the hypertrophied ventricle than through the normal ventricle. Consequently, the normal ventricle becomes depolarized considerably inadvance of the hypertrophied ventricle, and this causes a strong vector from the normal side of the heart toward the hypertrophied side, which remains strongly positively charged. Thus, the axis deviates toward the hypertrophied ventricle.
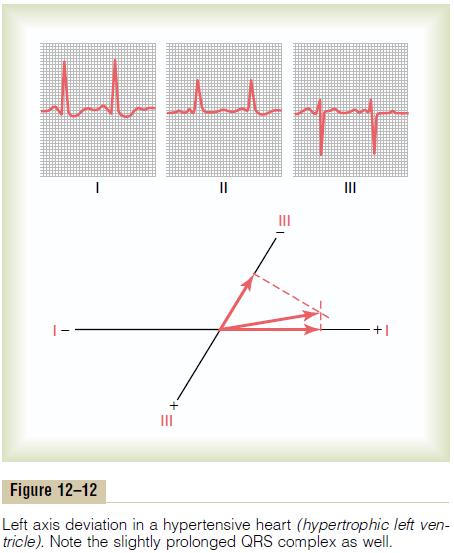
Vectorial Analysis of Left Axis Deviation Resulting from Hypertrophy of the Left Ventricle. Figure 12–12 showsthe three standard bipolar limb lead electrocardio-grams. Vectorial analysis demonstrates left axis devia-tion with mean electrical axis pointing in the -15-degree direction. This is a typical electrocardio-gram caused by increased muscle mass of the left ven-tricle. In this instance, the axis deviation was caused byhypertension (high arterial blood pressure), whichcaused the left ventricle to hypertrophy so that it could pump blood against elevated systemic arterial pres-sure. A similar picture of left axis deviation occurs when the left ventricle hypertrophies as a result of aortic valvular stenosis, aortic valvular regurgitation, orany number of congenital heart conditions in which the left ventricle enlarges while the right ventricle remains relatively normal in size.
Vectorial Analysis of Right Axis Deviation Resulting from Hypertrophy of the Right Ventricle. The electro-cardiogram of Figure 12–13 shows intense right axis deviation, to an electrical axis of 170 degrees, which is
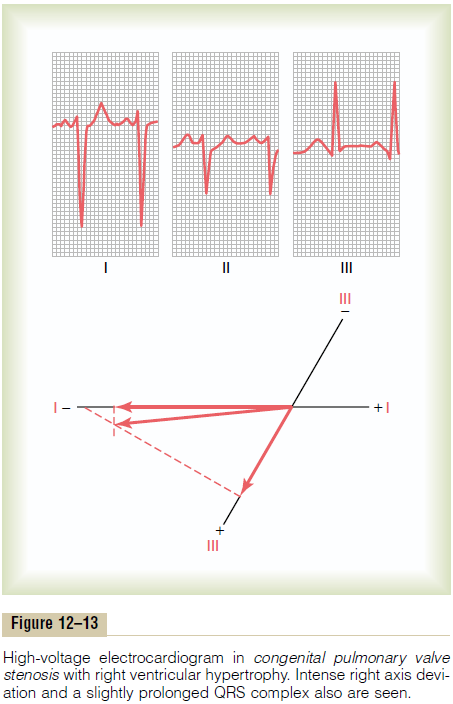
111 degrees to the right of the normal 59-degree mean ventricular QRS axis. The right axis deviation demon-strated in this figure was caused by hypertrophy of the right ventricle as a result of congenital pulmonaryvalve stenosis. Right axis deviation also can occur inother congenital heart conditions that cause hypertro-phy of the right ventricle, such as tetralogy of Fallot and interventricular septal defect.
Bundle Branch Block Causes Axis Deviation. Ordinarily, thelateral walls of the two ventricles depolarize at almost the same instant because both the left and the right bundle branches of the Purkinje system transmit the cardiac impulse to the two ventricular walls at almost the same instant. As a result, the potentials generated by the two ventricles (on the two opposite sides of the heart) almost neutralize each other. But if only one of the major bundle branches is blocked, the cardiac impulse spreads through the normal ventricle long before it spreads through the other. Therefore, depo-larization of the two ventricles does not occur even nearly simultaneously, and the depolarization poten-tials do not neutralize each other.As a result, axis devi-ation occurs as follows.
Vectorial Analysis of Left Axis Deviation in Left Bundle Branch Block. When the left bundle branch is blocked, cardiac depolarization spreads through the right ventricle two to three times as rapidly as through the left ventricle. Consequently, much of the left ven-tricle remains polarized for as long as 0.1 second after the right ventricle has become totally depolarized. Thus, the right ventricle becomes electronegative, whereas the left ventricle remains electropositive during most of the depolarization process, and a strong vector projects from the right ventricle toward the left ventricle. In other words, there is intense left axis devi-ation of about -50 degrees because the positive end of the vector points toward the left ventricle. This is demonstrated in Figure 12–14, which shows typical left axis deviation resulting from left bundle branch block.
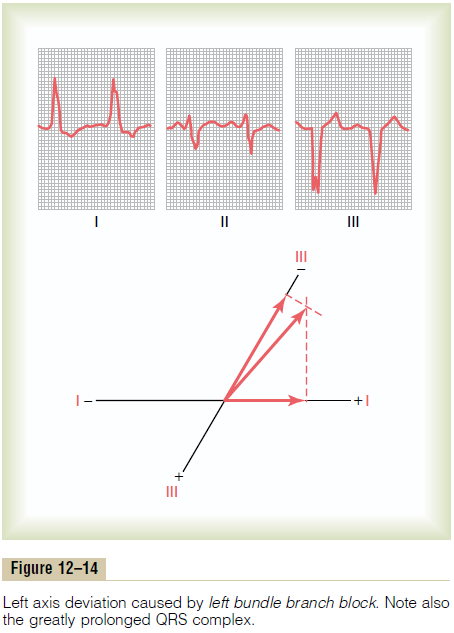
Because of slowness of impulse conduction when the Purkinje system is blocked, in addition to axis devi-ation, the duration of the QRS complex is greatly pro-longed because of extreme slowness of depolarization in the affected side of the heart. One can see this by observing the excessive widths of the QRS waves in Figure 12–14. This is discussed in greater detail later. This extremely prolonged QRS complex differentiates bundle branch block from axis deviation caused by hypertrophy.
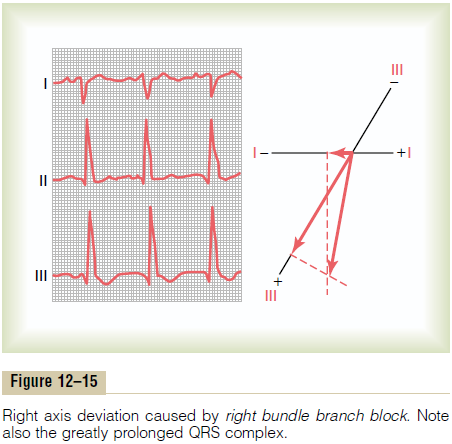
Vectorial Analysis of Right Axis Deviation in Right Bundle Branch Block. When the right bundle branchis blocked, the left ventricle depolarizes far more rapidly than the right ventricle, so that the left side of the ventricles becomes electronegative as long as 0.1 second before the right. Therefore, a strong vector develops, with its negative end toward the left ventri-cle and its positive end toward the right ventricle. In other words, intense right axis deviation occurs. Right axis deviation caused by right bundle branch block is demonstrated, and its vector is analyzed, in Figure 12–15, which shows an axis of about 105 degrees instead of the normal 59 degrees and a prolonged QRS complex because of slow conduction.
Related Topics