Production Analysis | Economics - Iso-quants | 11th Economics : Chapter 3 : Production Analysis
Chapter: 11th Economics : Chapter 3 : Production Analysis
Iso-quants
Iso-quants
Production
function may involve, at a time, the use of more than one variable input. This
is presented with the help of iso- quant curves. The two words ‘Iso’ and
‘quant’ are derived from the Greek language, meaning ‘equal’ and ‘quantity’
respectively. In our presentation only two factors, labour and capital are
used.
In
Economics, an iso-quant is a curve drawn by joining the combinations of
changing the quantities of two or more inputs which give the same level of
output. Isoquants are similar to indifference curves.
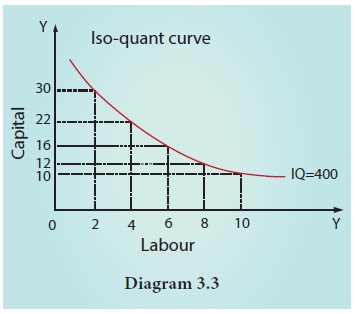
An iso-
quant curve can be defined as the locus of points representing various
combinations of two inputs capital and labour yielding the same output. The
iso-quant is also called as the “Equal
Product Curve” or the “Product
Indifference Curve”
1. Definition of Iso-quant
According to Ferguson, «An iso-quant is a curve showing all possible combinations of inputs physically capable of producing a given level of output”
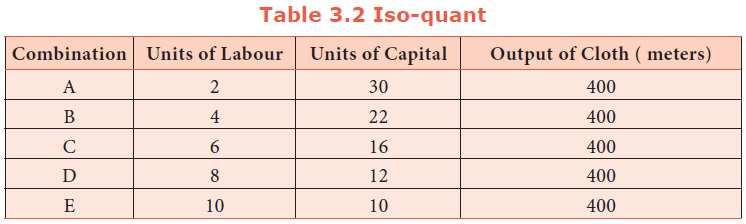
It is
seen from the table 3.2 that the five combinations of labour units and units of
capital yield the same level of output, i.e., 400 meters of cloth.
Iso-quants are based on the following assumptions.
1.
It is assumed that only two factors are used to
produce a commodity.
2.
Factors of production can be divided into small
parts.
3.
Technique of production is constant.
4.
The substitution between the two factors is
technically possible. That is, production function is of ‘variable proportion’
type rather than fixed proportion.
5.
Under the given technique, factors of production
can be used with maximum efficiency.
Iso-quant Schedule
Let us
suppose that there are two factors namely., labour and capital. An Iso-quant
schedule shows the different combinations of these two inputs that yield the
same level of output. It is given below.
2. Iso-quant Curve
An equal
product curve represents all those combinations of two inputs which
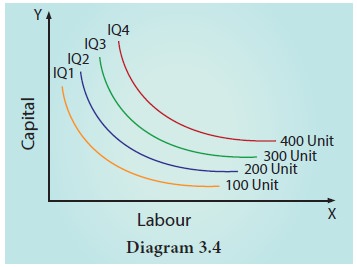
3. Iso-quant Map
An
iso-quant map has different iso-quant curves representing the different
combinations of factors of production, yielding the different levels of output.
In simple term, an iso-quant map is a family of iso-quants. In other words, if
more than one iso-quant is drawn in a diagram, it is called iso-quant map.
3. Properties of Iso-quant
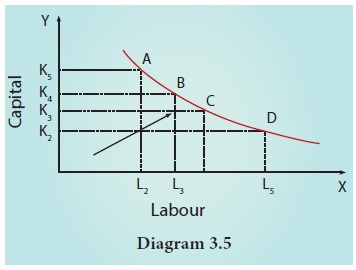
1. The iso-quant curve has negative slope.
It slopes downwards from left
to right indicating that the factors are substitutable. If more of one
factor is used, less of the other factor is needed for producing the same level
of output.
In the
diagram combination A refers to more of capital K5 and less of labour L2. As
the producer moves to B, C, and D, more labour and less capital are used.
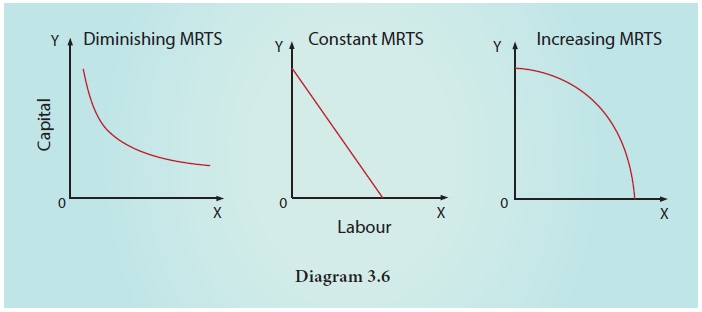
2. Convex to the origin.
This
explains the concept of diminishing Marginal Rate of Technical Substitution
(MRTSLK). For example, the capital substituted by 1 unit of labour
goes on decreasing when moved from top to bottom. If so, it is called
diminishing MRTS. Constant MRTS (straight line) and increasing MRTS (concave)
are also possible. It depends on the nature of iso-quant curve.
This means that factors of production are substitutable to each other. The capital substituted per unit of labour goes on decreasing when the iso-quant is convex to the origin.
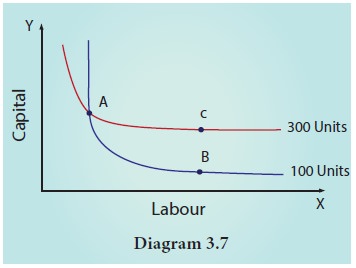
3. Non inter-section of Iso-quant curves.
For
instance, point A lie on the iso-quants IQ1 and IQ2. But the point C shows a
higher output and the point B shows a lower level of output IQ1. If C=A, B=A,
then C=B. But C>B which is illogical.
4. An upper
iso-quant curve represents a higher level of output.
Higher
IQs show higher outputs and lower IQs show lower outputs, for upper iso-quant
curve implies the use of more factors than the lower isoquant curve.
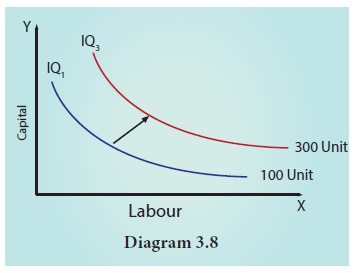
The arrow
in the figure shows an increase in the output with a right and upward shift of
an iso-quant curve.
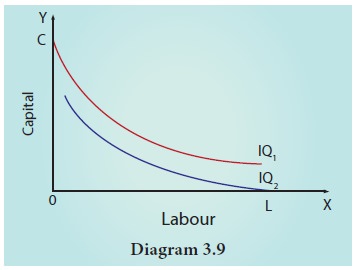
5. Iso-quant
curve does not touch either X axis or Y axis.
No
iso-quant curve touches the X axis or axis because in IQ1, only capital is
used, and in IQ2 only labour is used.
Related Topics