Chapter: Pharmaceutical Drug Analysis: Amperometric Methods
Amperometric Methods: Theory
THEORY
Assuming that the migration current (Im) is virtually
eliminated by the addition of a reasonably enough supporting electrolyte then
the only cardinal factor which would affect the limiting current would be the rate
of diffusion of the electro-active substance from the main body of the solution
to the surface of the electrode.
Thus, we may have :
Diffusion current = Limiting current – Residual current
It follows from above that the diffusion current is
directly proportional to the concentration of the electro-active substance
present in the solution. Now, if a situation is created whereby a portion of
the electro-active substance is eliminated by interaction with a specific
reagent, the diffusion current shall decrease significantly. It represents the
fundamental underlying principle of amperometric method or amperometry. Hence,
at an appropriate applied voltage the apparent diffusion current is measured as
a function of the volume of the titrating solution added. Now, if a graph is
plotted between the ‘current’ against
the ‘volume of reagent added’, the end-point will be represented by the point of
intersection of two lines indicating the change
of current both before and after the equivalence is achieved.
1 TITRATION CURVES
The most commonly obtained various kinds of curves
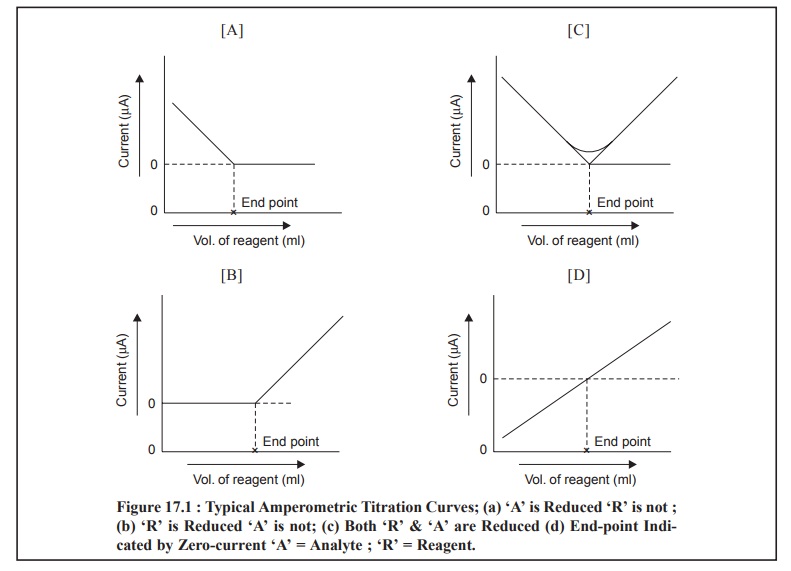
encountered in amperometric methods are illustrated in Fig. 17.1 (a) through (d) ; and each of them shall be discussed briefly as follows :
Fig. 17.1 (a) : It represents a titration
wherein the analyte reacts at the electrode whereas the reagent does not. In other words, only the
substance under titration gives rise to a diffusion current ; whereby the
electro-active substance is removed from the solution by means of precipitation
with an inactive substance.
Example : The titration of Pb2+ with SO4 2– or C2O42– ions. An appreciably high potential is usually applied to yield a diffusion current for lead. From Fig. : 1(A),
one may evidently observe a linear decrease in current because Pb2+
ions are removed from the solution by precipitation. The small curvature just
prior to the end-point (or equivalence point) shows the incompleteness of the
analytical reaction in this particular region. However, the end-point may be
achieved by extrapolation of the linear portions, as shown in the said figure.
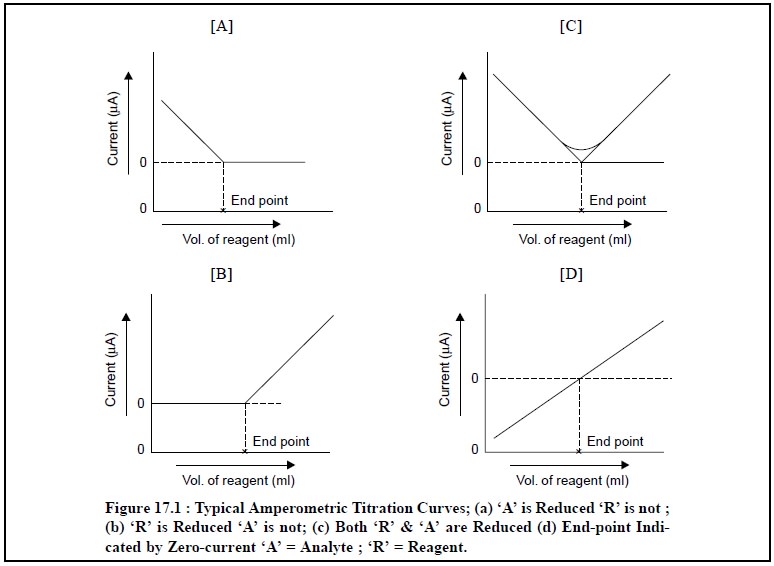
Figure 17.1 (b) : It designates typical of an
amperometric titration curve wherein the reagent exclu-sively reacts at the
microelectrode surface and the analyte does not. In other words, the reagent
gives rise to a diffusion current, whereas the solute does not ; it means an
electro-active precipitating reagent is being added to an inactive substance.
Examples : (a) Titration of Mg2+ with 8-hydroxyquinoline. In this
particular instance, a diffusion current
for 8-hydroxyquinoline is normally achieved at – 1.6 V Vs Standard Calomel Electrode (SCE), whereas Mg2+ ion is
more or less inert at this potential.
(b) Titration
of Ba2+ or Pb2+ ions with SO4– ions.
Figure 17.1 (c) : It represents an amperometric
method wherein the solute as well as the titrating reagent afford diffusion currents ; and give rise to a sharp
V-shaped curve. The end-point may be obtained by extrapolation of the lower-end
of the V-shaped portion of the curve as depicted in the above Figure.
Examples : (a) Titration of Ph2+ ion with Cr2O72– ion. The Figure : 17.1 (c) corresponds to the amperometric titrations of Pb2+
and Cr2O72– ion at an applied potential more
than – 1.0 V ; when both these ions afford diffusion currents at this very
potential and the end-point is duly signalled corresponding to a minimum in the
curve.
Figure 17.1 (d) : In this particular instance
the current undergoes a change from cathodic to anodic or vice-versa. Thus, the
final end-point of the potentiometric titration is indicated by a zero-current
as depicted in Figure 17.1 (d). Since the resulting diffusion
coefficient of the reagent is found to be slightly different from the
corresponding substance under titration, therefore, the slope of the line just
before the end-point actually differs very slightly from that after the
end-point. However, in actual practice it is rather convenient to add the
reagent unless and until the current attains a zero value.
Examples: (a) Titration of I–
ion with Hg2+ ion (as
nitrate),
(b) Titration
of Ti3+ ion in an acidified tartaric acid,
[CH(OH)COOH]2, medium with Fe3+ ion.
In addition to the above four types of amperometric methods cited, there also exist a
plethora of titrations involving neutralization and complex ion formation that
have been accomplished successfully, for instance :
(i)
Amperometric method for the study of precipitation reactions, e.g., salicylaldoxime (or
salicylaldehyde oxime), dimethylglyoxime, have been used for such type of
studies.
(ii) Halides,
such as : I–, Br– and Cl– have been titrated
at a less negative potential by virtue of the fact that in these titrations the
main indicator reaction is the deposition of silver from aquo-silver ions.
(iii) Micromolecular
solutions of Cd2+ ions against ethylene diaminetetra-acetic acid
(EDTA) have been carried out amperometrically.
2. CORRECTIONS FOR THE VOLUME CHANGE
The corrections for the volume change may be affected by
adopting either of the two methods
de-scribed below namely :
Method I : In order to obtain plots
between current (μ A) and volume of reagent (ml)
specifically with linear regions
both before and after the end-point (or equivalence point), it is absolutely
necessary to apply the corrections for the volume change which results from the
added titrant. This correction is applied by multiplying the measured
corresponding diffusion current (Id) by the following factor :
[V + v] / V
where, V = Initial volume of the solution, and
v = Volume of the titrating reagent added.
Method II : The above correction caused
due to the volume change may be eliminated to a great extent by making use of the reagent at a concentration of 10 to 20
times higher than that of the corresponding solute, and subsequently adding the
same from a semimicro-burette very carefully. The use of concentrated reagents
have the following advantages, namely :
(a) Relatively
very small amount of dissolved O2 is incorporated into the system,
which eliminates completely the prolonged bubbling of inert gas (e.g., N2) through the medium
after each addition of the reagent, and
(b) Elimination
of ‘migration current’ by simple
addition of enough supporting electrolyte. If need be, an appropriate maximum
suppressor can also be incorporated judiciously.
3. ADVANTAGES OF AMPEROMETRIC TITRATIONS
A few cardinal advantages of amperometric titrations are
described below, namely :
·
The amperometric titration may normally be performed very
quickly, because the equivalence point (or end-point) is determined
graphically. A series of measurements at constant applied volt-age just prior
and latter to the end-point are more than enough.
·
The titrations can be carried out both satisfactorily and
effectively in such situations where the solubility relations offer erroneous
and unsatisfactory results given by visual indicator and potentiometric
methods. For instance :
(a) A reaction
product which is hydrolysed significantly e.g.,
acid base titrations, and
(b) A reaction
product that is appreciably insoluble e.g.,
precipitation reaction.
It is quite evident that the readings in the vicinity of
end-point offer practically no specific value and importance in amperometric
titrations. Because the readings are mostly taken in particular zones where
there exists either an excess of reagent or of titrant, and which specific
points the hydrolysis or solubility is entirely suppressed by the effect of
Mass Action. The point of intersection of these lines ultimately gives rise to
the desired end-point.
·
A good number of amperometric titrations may be performed
on considerably dilute solutions (say, 10–4 M) at which neither
potentiometric nor visual indicator methods ever can give precise and accurate
results, and
·
In order to eliminate the migration current (Im) completely
either the ‘foreign salts’ already
present cause little interference or invariably added so as to serve as the ‘supporting electrolyte’.
Related Topics